


ISSN: 0973-7510
E-ISSN: 2581-690X
A total of 19 yeasts were isolated in the process of identifying the optimum starter cultures for the production of fruit wine. Three strains were chosen from among these isolates, purified, and evaluated for their ability to ferment grapefruit juice. In pure cultures, three yeast strains (S1, S2, and S3) that were separated from grapefruits were examined for their ability to produce fruit wine. The impact of starting pH on growth, growth capacity in the presence of ethanol, biomass evolution, and the physicochemical characteristics of the resulting wines were all ascertained. The 18S ribosomal DNA gene sequencing indicates that the two isolated strains (S1 and S3) are members of the species Debaryomyces nepalensis (96.34%) and Candida tropicalis (98.49%), respectively. The results showed that the (S1) and (S3) starters showed the best fermentation power with a remarkable production of the alcohol content which is 11.63 (%v/v) and 11.4 (%v/v) respectively, while a decrease in the specific density and the soluble solids rate was observed in a minimum time of (144 h). All starters had the ability to grow under acidic (3, 4, 5, 6) and basic (8) pH conditions, but the highest growth was between pH (3-4). A decrease in growth is recorded for all strains above 16 (%v/v) of ethanol. However, these decreases vary by strain. Culture with strain (S2) is the medium where the greatest decrease is observed, regardless of the ethanol content. The temperatures at which these sourdoughs could grow were 25 °C, 30 °C, and 35 °C. At 30 °C, the highest growth was recorded. Lastly, for the (S1) and (S3) yeast strains used for the wine production trial, the ideal growth conditions in terms of temperature, Brix, and pH were 30 °C, 30°B, and 3-4, respectively.
Isolation, Yeasts Species, Wine Fermentation, Candida tropicalis, Debaryomyces nepalensis
For producers, who constitute a sizeable portion of the population, artisanal alcoholic beverages are a significant source of revenue. These traditional producers face some obstacles, nevertheless, such as a very short shelf life, a very unstable final product, and a wide range of organoleptic characteristics. All of these problems contribute to low profitability.1
The types of starter culture being employed is often the cause of most of these problems. In fact, this one frequently comes from a fermentation byproduct. It is therefore an unregulated ferment with an undetermined composition. Its application frequently results in a low-quality final product that unavoidably experiences a quick microbiological change and is only marketable for a brief period of time, which causes revenue loss furthermore, these drinks contain pathogens that give them a character that is harmful to customers’ health in addition to the fermenting germs that this sort of ferment gives. Due to sociocultural and economic factors, the agri-food industry, and especially the handicraft industry, is severely constrained today. Traditional brewers, who are part of this wonderful group, are not exempt from this fact. They have to deal with the necessities that cannot be avoided, which are primarily the variety of items, the price-quality ratio, and consumer security. Numerous investigations were conducted in an effort to uncover answers. A few of them provided descriptions of the production procedures.2 The bacteria participating in this process have been found and described by other researchers.3,4 In the same line of thought, the best way to address these issues and supply the resources required for product uniformity is to employ well known starter cultures.5 In keeping with this suggestion, scientists are concentrating more on identifying fermenter strains and creating starter cultures.6,7 Around the world, experiments have been conducted with using yeast strains as starting cultures to produce fermented beverages such “cachaca”,8 “gowe”,9 “togwa”, 10 “tchapalo”,11 and “dolo”.6
The alcoholic fermentation stage is one of the most crucial processes in the production of wines, which needs starter ferments composed of yeasts with physiological and technological characteristics in order to develop properly. Every strain of yeast has both fermentative and technical qualities. Therefore, it is widely known that a strain of yeast chosen for industrial fermentation must be able to tolerate and thrive at high ethanol concentrations, which are known to have antimicrobial properties, for the duration of its production. In a similar vein, this yeast variety needs to be chosen based on its capacity to withstand comparatively high temperatures in order to thrive in hot climates. This work was undertaken with the aim of evaluating the fermentation potential of isolated grapefruit yeasts under thermal, osmotic and ethanol stresses so that they can be exploited in the production of fruit wine on a semi-industrial scale.
Sample collection
Mature and ripe grapefruits (Citrus maxima) that have been used for the isolation of yeasts strains and wine production were purchased from an orchard located in the Ziling District, in the Arrondissement of Maroua I, Region of the Far-North of Cameroon. With an average temperature of 25 °C in the coolest months and 36 °C in the hottest, as well as an average annual rainfall of 726.2 mm, the climate is Sudano-Sahelian. The biological material is brought to the laboratory under aseptic conditions; then it is cleaned and washed.
Isolation and identification
The fruits were sliced, surface disinfected with 70% alcohol, cleaned with distilled water, and left out in the field for 48 hours to act as bait. The fruit juice was aseptically removed and diluted with sterile distilled water at a ratio of 10-6. As previously reported,10 yeasts were recovered using 0.1 mL of the proper dilutions spread plating of each sample on sabouraud-chloramphenicol agar (Difco, Detroit, MI) and yeast extract agar (Oxoid, England). Pure cultures were obtained using the traditional streaking method after 48 hours after inoculation at 30 °C. Purified cultures had been stored on potato dextrose agar slants at -4 °C until required. Numerous physiological and biochemical experiments were performed on the isolates, including as sugar fermentation, carbon compound assimilation, growth at 25, 30, 35, and 40 °C, and growth in the presence of elevated sugar and ethanol levels.
Phenotypic and biochemical identification
Identifying physical, biochemical, and cultural traits has been the basis for yeast taxonomy.12 We decide to utilize the commercial API 20C AUX kit (bioMerieux, Marcy l’Etoile, France) to identify isolated strains.13 In accordance with the manufacturer’s instructions, this test is carried out in galleries consisting of 20 cups of 19 different sugars and a control cup. It is predicated on the strains’ ability to ferment carbohydrates and absorb carbon and nitrogen components.
The gallery is incubated for 24 to 48 hours at 29 ± 2 °C after a 140 µL aliquot of the yeast suspension in minimal medium (API C medium, turbidity = 2 McFarland) is put in each cup. Using the bioMerieux analytical catalogue, the digital profiles were created from the reaction diagrams for identification. isolates that will resemble the species Saccharomyces cerevisiae described in the literature in terms of physical traits and profiles of carbohydrate absorption.14,15 Because of its distinct scent and capacity to absorb carbohydrates (glucose, galactose, sucrose, maltose, trehalose, and α-methyl-glucoside).
Molecular identification
DNA extraction
The Promega extraction kit (Promega Corporation, Madison, New England Biolabs) was used to extract the entire genomic DNA of the chosen isolates from a new colony that was 24 hours old and growing on Sabouraud Chloramphenicol agar medium. Cells we recollected after centrifugation (13000 rpm, 2 min, Sigma 3K12 centrifugation system, Bioblock Scientific, France) and reconstituted in 293 microliters of a 50 mM EDTA formulation. To break down the yeast wall, 7.5 µL of lyticase (75 units/µL) was then added to the solution and incubated for 60 minutes at 37 °C. The centrifuged cells were mixed with 100 µL of the protein precipitation solution and 300 µL of the nuclear membrane lysis solution. After adding 300 µL of isopropanol to precipitate the DNA, it is rinsed with 300 µL of 70% ethanol. 50 µL of a solution containing 10 mM Tris and 1 mM EDTA was used to rehydrate the DNA. The resulting DNA solutions were kept for the Polymerase Chain Reaction at -20 °C.
Polymerase Chain Reaction (PCR) conditions and sequencing
The PCR reactions were conducted in a heat cycler (TECHNE, 3PRIMEBASE/02, UK), per reference.16 In summary, the 50 µL PCR reaction mixture included 25 µL of the PCR Master mix (Quick Load Taq 2x from New England Biolabs), 15 µL nuclease free water (Promega), and 0.5 µM primers ITS1 (5′-TCC GTA GGT GAA CCT GCG G-3′) and ITS4 (0.5′-TCC TCC GCT TAT TGA TAT GC -3′) (Eurofins, genomic, Munich, Germany). The conditions for the PCR were as follows: 5 minutes of initial denaturation at 94 °C, 30 cycles of denaturing at 94 °C for 1 minute, 2 minutes of annealing at 55 °C, 2 minutes of elongation at 72 °C, and 10 minutes of final elongation at 72 °C. In a 50 x TAE buffer (40 mM Tris, 20 mM acetic acid, and 1 mM EDTA) containing 1 µg/mL ethidium bromide, PCR products were electrophoresed at 100V on a 1% agarose gel. Gels were photographed after being stained with ethidium bromide and examined under a UV lamp. The final PCR product was sequenced by GATC Biotech (Eurofins Genomics) as described in previous reports.17 Using blastn, the sequences were compared to other sequences found in the National Center for Biotechnology Information’s (NCBI) GenBank database (http://www.ncbi.nlm.nih.gov). Alignment with the reference sequences in the database is expressed as a percentage of homology published sequences.14,18
Fermentation capacity of isolated strains
A fermentation test was performed on the chosen yeast strains in comparison to a reference strain. Synthetic medium and grapefruit juice were used to develop the strains. The cultures were carried out in triplicate at 25 °C and under static conditions in two Erlenmeyer flasks containing one liter of standardized YPD liquid media each. To guarantee anaerobic behavior, pre-cultures of the tested strains were added to Erlenmeyer flasks at a concentration of roughly 106 cells/mL. The flasks were then sealed with silicone stoppers.19 Installing sterile plastic piping that has been soaked in water and passes through the caps allows for carbon dioxide exhaust. Fermentation monitoring was carried out by taking samples of 100 mL at 0, 24, 48, 72, 96, 120 and 144 hours of culture. The fermentation operation was carried out in a triplicate in order to obtain an average value representative of the different analyses. The ethanol concentration, Brix, specific gravity and pH in the fermented musts were determined at regular time intervals.
Effect of environmental stresses on the growth of retained strains
Osmotic pressure, temperature, and ethanol concentration were examined as stressors. Every test was conducted using grapefruit juice that has been previously modified for each type of test. To achieve cell concentrations, close to 5.0 on the McFarland scale, the pure cultures were revived by inoculating them with 9.0 mL of 0.85% saline solution. For each of the three yeasts, 0.02 mL of the suspension culture was added in triplicate to test tubes holding 10 mL of grapefruit juice.
Growth at different temperatures
The strains’ development at various temperatures (25, 30, 35, and 40 °C) was evaluated by the methods described in previous reports.14 Ten millilitres of YPD broth were used to inoculate each strain. After that, the culture tubes were stirred at 150 rpm for 72 hours at each temperature.
Optical densities (ODs) were measured at 600 nm every 24 hours and the growth of each strain is assessed by the ratio of the measured optical densities to time ‘’t’’ and at the start of culture according to formula 1 below:
rOD = OD600 f / OD600i ..(1)
OD600f: final optical density; OD600i: initial optical density
Growth at different pH levels
The strains’ development at various pH values (3, 4, 5, 6, and 8) was tested by the method described in previous reports.14 The strains were previously cultivated on Sabouraud chloramphenicol agar for 48 hours at 30 °C. Each strain’s colony was then pre-cultured in 2 milliliters of Sabouraud chloramphenicol broth. This pre-culture is then used to inoculate 10 mL of Sabouraud chloramphenicol broth, whose pH was adjusted using either 1 M phosphoric acid or 1 M NaOH, with an initial charge of 0.1 optical density (OD).
Osmotic pressure tolerance
High concentrations of sugars can cause osmotic stress on growing yeasts.19 Various grapefruit juices at a Brix rate of 18, 21, 24, and 27 and 30 (%w/v) were prepared in 1 L Erlenmeyer flasks. The juices’ final pH is set at 5. These Brix were obtained from the starting juice either by dilution in distilled water or by vacuum concentration using a rotavapor (Buchi, Germany). Samples were taken at 0 h, 24 h, 48 h and 72 h for the determination of the biomass at 600 nm.
Ethanol tolerance
The method described in previous reports was used to assess ethanol stress.20 The pH of the grapefruit juice was maintained at 5.0 ± 0.1 by adjusting it to 12°Brix using distilled water. Fresh and pure colonies cultivated on boxes were used to obtain the strains. To inoculate the culture, these cells were utilized. Commercial ethanol absolute (Nobre 92.8°INPM) was added to the medium to set the alcohol content at 8%, 12%, 16%, 20%, and 24% (v/v). To prevent the growth of bacteria, 5% chloramphenicol is added to the YPD broth’s ingredients. Using an OD measurement at 600 nm, cell growth was estimated.
Laboratory scale wine production testing with isolated strains
Referring to previous experiments such as the part on tolerance to stressors, we found that the optimal values for strain growth were 30 °C for temperature, 30 (%w/v) for sugar content and 3-4 for pH. Alcoholic fermentation tests with the selected strains were carried out under these optimal conditions. Main ingredients used for the production of wine are shown in Table 1.
Table (1):
Ingredients used for the production of wine
| Ingredients | Type of wines | ||
|---|---|---|---|
| W1 | W3 | WT | |
| Grapefruit juice (mL) | 500 | 500 | 500 |
| Sucrose (%w/v) | 30 | 30 | 30 |
| Volume of starter (%v/v) | 0.5 | 0.5 | 0.5 |
| Volume distilled water (mL) | 1000 | 1000 | 1000 |
W1: wine produced with Candida tropicalis; W3: wine produced with Debaromyces nepalensis; WT: wine produced with control strain (Saccharomyces cerevisiae)
Preparation singular of yeasts starters culture
The (S1) and (S3) were cultivated for 24 hours at 30 °C on a rotary shaker at 60 rpm in sterile glucose yeast extract broth (glucose 2% w/v, yeast extract 1% w/v, peptone 0.5% w/v, and pH 4.5). Centrifugation was subsequently used to separate the cells (Sigma 3K12 centrifugation machine, Bioblock Scientific, France) at 5000 rpm for 10 minutes at 4 °C. The cells were employed as the pre-inoculum after being rinsed twice and resuspended in regular saline at a concentration of 107 cells/mL and then transferred individually into sterile grapefruit juice wort and incubated for 24 h. Ten milliliters of pre-inoculum were transferred into a 500 milliliter Erlenmeyer flask that contained 100 milliliters of grapefruit juice in order to create the inoculum. After that, the mixture was shaken at 60 rpm for the entire night at 30 °C.
“Must” Preparation and Fermentation
Wine was produced using grapefruit juice as the substrate. The grapefruit samples were washed delicately then cut into two equal parts using the sterile knife and pressed aseptically using a press device.21 Then, the juice obtained was filtered using a sterile cotton support with extremely tight pores in order to eliminate certain residues. The juice was then improved by adding cane sugar and tartaric acid to reach a pH of 3.5 and a total soluble solids (TSS) of 30°Brix. Must is the name given to the improved juice. Each of the starting cultures (S1), (S3) and the strain control (Saccharomyces cerevisiae) (0.5% v/v) were added to the must. For seven days, the fermentation process was conducted at 30 °C. For the purposes of this investigation, three replicates were kept. The samples were taken out for physicochemical, biochemical, and microbiological analyses at 0 and 9 days of fermentation. Three replications of the experiments were conducted.
Determination the Physicochemical Parameters of the ‘’Must’’ and ‘’Final wine’’
Determination of pH
The Mettler Toledo 405 DPAS-SC-K8S/325 digital pH meter was used to measure the wine samples pH. The electrodes were placed into 10 mL of the wine samples after calibration using pH 4.0 and 7.0 buffers, and the outcomes were noted.22
Titratable acidity measurements
The titrating method, as previously reported in the literature was utilized to evaluate the total titratable acidity.23 A beaker was filled with ten milliliters (10 mL) of the wine samples that had been collected. Two to three drops of one gram of phenolphthalein indicator per 100 mL were added, and the sample was titrated with freshly made 0.1 M sodium hydroxide solution (NaOH) until the pink hue persisted for thirty seconds. The following formula were used to determine the overall titratable acidity value, which was given in percent of lactic acid:
Titrable acidity (% lactic acid) = Volume NaOH used x Normality NaOH (0.1) x 90.08 / Volume of sample (mL) x 10 … (2)
Temperature measurement
Ten (10) mL of the “must” was put in a sterile beaker and a laboratory mercury bulb thermometer was inserted into the beaker to determine the temperature. The temperature changes in the course of the fermentation were recorded in degree Celsius (°C).22
Evaluation of Total Soluble Solids (TSS)
Approximately two droplets of the wine samples were applied to the portable ATC refractometer glass tip prism (RHB 90, Shenzhen, China). Using the equipment eyepiece, the TSS concentration was measured at room temperature during the day.22
Determination of alcohol content
The technique used to determine the alcohol content was adapted from methods reported in the literature.24 In summary, a volumetric flask was filled with 50 milliliters of wine. After that, the material was gradually added to a 100 mL volumetric flask, and distillation was carried out. After gathering 45 milliliters of the distillate, 50 milliliters of distilled water were added. Using the specific gravity bottle, the specific gravity was ascertained. The following formula was utilized to determine the relevant alcoholic content:
Alcohol content (% V/V) = W1-W0 / W2-W0 × 100 …(3)
Where, W0 = Weight of empty bottle; W1 = Weight of empty bottle + sample; W2 = Weight of empty bottle + sample + water.
Determination of dry matter
The dry matter content of the wines samples was determined by drying in the forced-air oven (Memmert-Germany) at a temperature of 105 °C until a constant weight was obtained according to the standard.25
Determination of total carbohydrates
Total sugar was measured using the phenol-sulfuric acid improved method as described previously.26 The glucose standard curve was used to determine the total sugar content expressed in g of glucose equivalent per 100 mL of sample (g GlcE/100 mL).
Determination of protein content
The total protein content was determined using the Kjeldahl method.27 After adding a Kjeltabs catalyst pellet (3.5 g of potassium sulfate (K2SO4) and 0.4 g of copper sulfate (CuSO4)) to a mineralization tube (Kjeldahl flask) containing 5 mL of sample (Pe), 10 mL of concentrated H2SO4 (0.1 N) is added. The prepared samples undergo three (3) hours of mineralization (complete discolouration of the solution) at 450 °C on a heating block. After that, about 50 milliliters of distilled water are added to the mineralized product to dilute it. After that, concentrated sodium hydroxide (10 N) is used for distillation. The 150 mL of distillate is gathered in a beaker with 5 ml of colored indicator made of boric acid, methyl red, and bromocresol green. 0.1 N of HCl is added to the mixture until the indicator becomes pink instead of green. The following formula is used to calculate the protein content in relation to dry matter :
% proteins / DM = [6.25 x 0.014 x 0.1x (ve-vb) x 100/ws] x 100 / 100 – %H] …(4)
Where, DM = Dry matter; Vb = Burette drop for blank; Ve = Burette drop for distillate; Ws = Weight of sample; 0.1 = Hydrochloric acid titer; 0.014 = Molar weight of nitrogen x10-3; %H = Percentage by mass of water.
Determination of ascorbic acid content
Using the 2,6-dichlorophenolindophenol (2,6-DCPIP) titration method, the ascorbic acid content is determined. The process involves oxidizing ascorbic acid to dehydroascorbic acid and reducing 2,6-DCPIP. As a result, it permits the measurement of ascorbic acid content in its reduced form. 2,6-DCPIP acts as a color indicator once ascorbic acid oxidation is finished, and its presence in solution imparts a distinctive pink hue.28 Formula for calculating ascorbic acid concentration was as follows:
Ascorbic acid content ( mg/100 mL) = (Ve-V0) x 20 / ( (Vs-V0) x 10) × 100 …(5)
Where Ve: volume of 2-6 dichloro-phenolindophenol poured to neutralize the “sample” metaphosphoric acid/acetic acid solution (mL); Vs: volume of 2-6 dichlorophenolindophenol poured to neutralize the ascorbic acid standard solution (mL); Vo: volume of 2-6-dichloro-phenolindophenol added to neutralize the metaphosphoric acid/acetic acid solution (mL).
Microbiological analyses of the ‘’Must’’ and the final wine
After 48 hours of incubation at 35 °C on Plate Count Agar, aerobic mesophilic bacteria are the primary focus of the total germ count. The procedure outlined in the standard NF V 08-051 is employed. The NF-V08-022 standard was followed for counting the yeasts. Chloramphenicol (0.05 g/L) was added to Sabouraud agar as the isolation medium. After pouring and setting the agar in Petri plates, 100 µL of each decimal dilution was spread out and plated on top. Incubation was conducted for 72 hours at 25 °C in an oven. The medium used to count lactic acid bacteria is Man Rogosa Sharp agar. 100 µL of the stock solution or the retained dilutions are applied to the surface of the previously poured agar on the solidified medium in petri dishes using a spreader rake. Anaerobic conditions are maintained in petri dishes at 35 °C for 24 to 48 hours. Eosin Blue Methylene agar was used to plate the total and fecal coliforms, which were subsequently anaerobically incubated for 24 hours at 35 °C and 45 °C. Aerobic spore-forming bacterial counts: After being heated to 80 °C for 10 minutes in a water bath, 10 milliliters of the suitable dilution were quickly cooled under running water. After that, a 100 µL aliquot of the proper dilution was spread-plated onto nutrient agar and incubated for 48 hours at 35 °C.
Statistical analysis of data
The results were entered into a specifically designed Excel database and given as mean ± SD. Utilizing Statgraphics Centurion 16.1 software (Technologies Inc., Virginia, USA), the statistical analysis was carried out. ANOVA, or one-way analysis of variance, was used to compare the means. A significance level of p < 0.05 was deemed appropriate for estimating mean differences using Tukey’s honestly significant difference multiple comparison test. The program Microsoft Excel 2016 was used to make the graphs.
Yeast species identification
Macroscopic and microscopic characterization of yeast isolates
Most yeasts have an oval form, as shown in Figure 1. Certain colonies also have a cylindrical shape, as seen in Figure 1. Numerous morphologies, including oval and cylindrical ones with single cells, pairs, and groups, have been documented for fermentative yeasts. The yeasts that have a matte surface, convex elevation, flat edges, slimy texture, white hue, and a colony diameter of 0.5 to 5 mm are also notable in Figure 1. Yeasts can produce one to ten ascospores per ascus generatively or vegetatively through multipolar budding (Figure 1). N-acetyl D-glucosamine and raffinose cannot be fermented by this yeast, although it can quickly ferment sucrose, glucose, and galactose.29
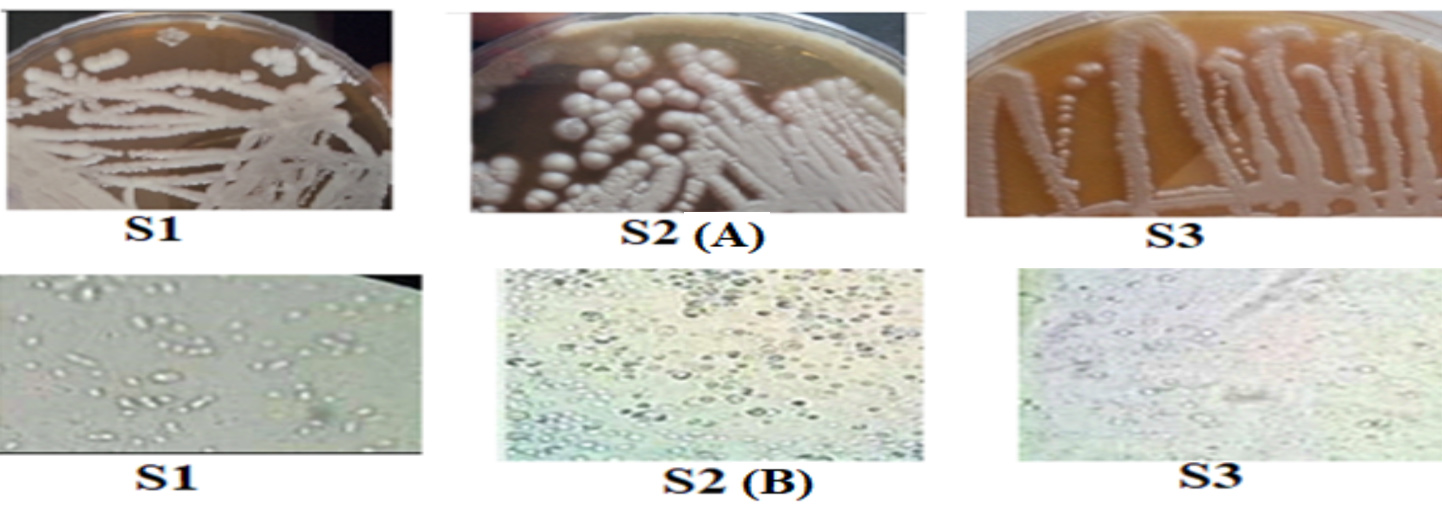
Figure 1. Macroscopic observation after purification in sabouraud medium (A) and microscopic image (B) of the yeasts isolated
The isolated yeast species’ morphological and biochemical traits
The isolated yeast’s morphological and biochemical properties are displayed in Table 2. Of the nineteen (19) strains isolated, only isolates that showed good cell growth in a liquid medium with a characteristic ethanol odour were tested for sugars using API 20C AUX galleries. Three isolated suspect strains exhibited fermentation activities similar to those of the genus Saccharomyces (Table 2). By referring to the identification table provided by bioMerieux, the strains (S1) and (S3) were able to metabolize almost all the sugars (glucose, galactose, N-Acetyl D-Glucosamine, sucrose and raffinose) usually degraded by Saccharomyces cerevisiae. Similar observations have been described in previous reports.14,15
Table (2):
Morphological and biochemical characteristics of selected isolates
| Isolates | Morphological Characteristics | Biochemical Characteristics, test assimilation of sugars (API ID 20 C) | |||||||||||||||||||||||
|---|---|---|---|---|---|---|---|---|---|---|---|---|---|---|---|---|---|---|---|---|---|---|---|---|---|
| Shape | Elevation | Color | Bud | GLU | GAL | SAC | MAL | a-Met | TRE | 2KG | ARA | XYL | ADO | XLT | INO | GLY | SOR | MDG | NAG | CEL | LAC | MLZ | RAF | 0 | |
| (S1) | Round | Ovoid | White | multipolar | + | + | + | + | + | + | – | – | – | – | – | – | – | – | – | + | – | – | – | – | – |
| (S2) | Round | Bomb | White | unipolar | + | – | + | – | – | – | – | – | – | – | – | – | – | – | – | – | – | + | – | – | – |
| (S3) | Round | Ovoid | Withe | unipolar | + | + | + | + | + | + | – | – | – | – | – | – | – | – | – | + | – | – | – | – | – |
Key: GLU: Glucose, GAL: Galactose, SAC: Saccharose, MAL: Maltose, a-methyl-D-glucoside, TRE: Trehalose, 2KG: 2-Ketoglutanate, ARA: Arabinose, XLY: D-Xylose, ADO: Adonitol, XLT: Xylitol, INO: Inositol, GLY: Glycerol, SOR: Sorbitol, MDG: A Methyl-D Glucose, NAG: N-Acetyl D-Glucosamine, CEL: Celiobiose, LAC: Lactose, MLZ: Melezitose, RAF: Raffinose, 0: Control, +: Positive reaction, -: Negative reaction
Molecular strain identification
Polymerase Chain Reaction (PCR) and sequencing
The results of the ribosomal DNA amplification profiles of the identified yeast strains (S1), (S3) and the unidentified strain (S2) are presented in Figure 2.
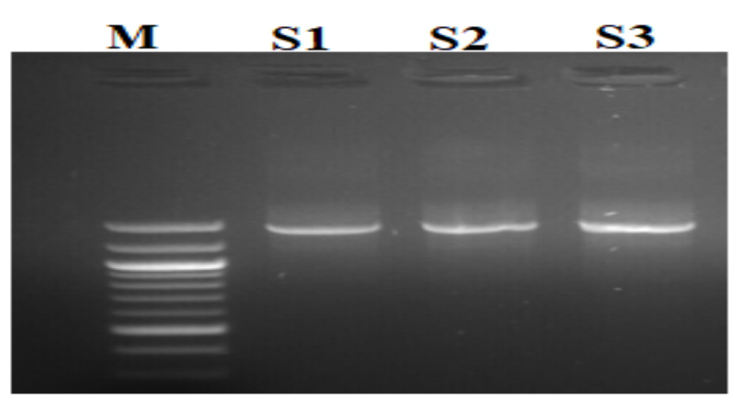
Figure 2. Isolate Electropherograms and reference standards. M: Standard; S1, S2 and S3: yeast strains to be identified
The most reliable method of identifying yeast species is still molecular identification, which includes phylogenetic classification approaches by internal transcript amplification (ITS1) of the 18S region of ribosomal DNA.12 Using the BLAST research tool, the amplified DNA was sequenced and compared to other sequences in the NCBI database.30 Yeast isolates were found using sequence similarity searches in the GenBank database. Isolates were identified by similarity indices more than 95%, which was regarded as a perfect match. The two strains (S1) and (S3) that were isolated from grapefruits, respectively, have 98.49% homology with the species Candida tropicalis and 96.34% homology with the species Debaryomyces nepalensis, as shown in Table 3. These identified species have been reported as strains involved in alcoholic fermentation, particularly that of craft beer production and wines.31-34
The most reliable method of identifying yeast species is still molecular identification, which includes phylogenetic classification approaches by internal transcript amplification (ITS1) of the 18S region of rDNA. After the amplified DNA was sequenced, it was compared to other sequences in the NCBI database using the BLAST research tool. Yeast isolates were found using sequence similarity searches in the GenBank database. Isolates were identified by similarity indices more than 95%, which was regarded as a perfect match. The two strains (S1) and (S3) that were isolated from grapefruits, respectively, have 98.49% homology with the species Candida tropicalis and 96.34% homology with the species Debaryomyces nepalensis, as shown in Table 3. These identified species have been reported as strains involved in alcoholic fermentation, particularly that of craft beer production and wines.
Table (3):
Yeast strains identified through search for similarity GenBank database of (NCBI)
Isolate code |
Isolates No. |
Genbank corresponding species |
Percent of identity |
GenBank Accession No. of reference species 18S rDNA |
|---|---|---|---|---|
S1 |
493 |
Candida tropicalis |
98.49% |
NR_111250.1 |
S3 |
578 |
Debaromyces nepalensis |
96.34% |
NR_130651.1 |
S2 |
– |
– |
– |
– |
Key: S1 = Candida Tropicalis; S3 = Debaromyces nepalensis; S2 = Strains no identified
Testing the fermentability of isolates
Changes in the total alcohol and soluble solids content throughout the fermentation process
Figure 3(A) and Figure 3(B) display the outcomes of the wort’s fermentation-related changes in its total alcohol and soluble solids content, respectively. From the analysis of the results in Figure 3, it can be seen that the purification procedure by successive cultures on the specific PDA medium showed that these strains had a predominant fermentative character. Indeed, the four strains tested were able to metabolize, with varying degrees, the fermentable sugars present in the wort. However, strains (S1) and (S3) gave the highest ethanol production which was about 11.63 (%v/v) and 11.4 (%v/v) in a minimum time of (144 h) respectively. While the control strain T produced a high alcohol content that about 12.5 (%v/v) in (144 h). Only the strain (S2) had the lowest alcohol content, which is around 8.2 (%v/v) produced in (144 h; During fermentation, the amount of alcohol in fermenting wort rises. The metabolism of yeasts, which consume the carbohydrates in the wort constantly until all of the available sugars have been utilized, is responsible for this growth. This outcome aligns with the research reported by other researchers.35
This evolution of soluble solids during fermentation is shown in Figure 3B. At the end of these results, we note that there is a remarkable decrease in sugars in all the strains used, but to varying degrees. This value drops from 22 to 14°Brix for (S1), from 22 to 16.4°Brix for (S2), 22 to 14.4°Brix and 22 to 13.6°Brix for (S3) and the Control strain, respectively. This decline is predominantly evident within the first 48 hours for the four strains (Figure 3B). The kinetics of alcohol formation are proportional to the amount of sugar present in the wort, as demonstrated by the evolution of the alcohol content during fermentation. The decrease in TSS from wines was a sign that the wine yeast was using sugar sources to produce ethanol. Similar outcomes, namely a slow decline in sugar and an increase in ethanol, were noted as the bael fruits fermented into wine.36 The decrease in soluble solids and increase in alcohol content during fermentation could be due to the increase in total yeast number during aerobic fermentation. As the primary supply of nutrition for the fermenting yeasts, the decline in fermentable sugars was anticipated. The amount of sugar extracted from the juice by the fermenting organisms was shown by the drop in Brix at the end of fermentation. this result is in line previous reports.37
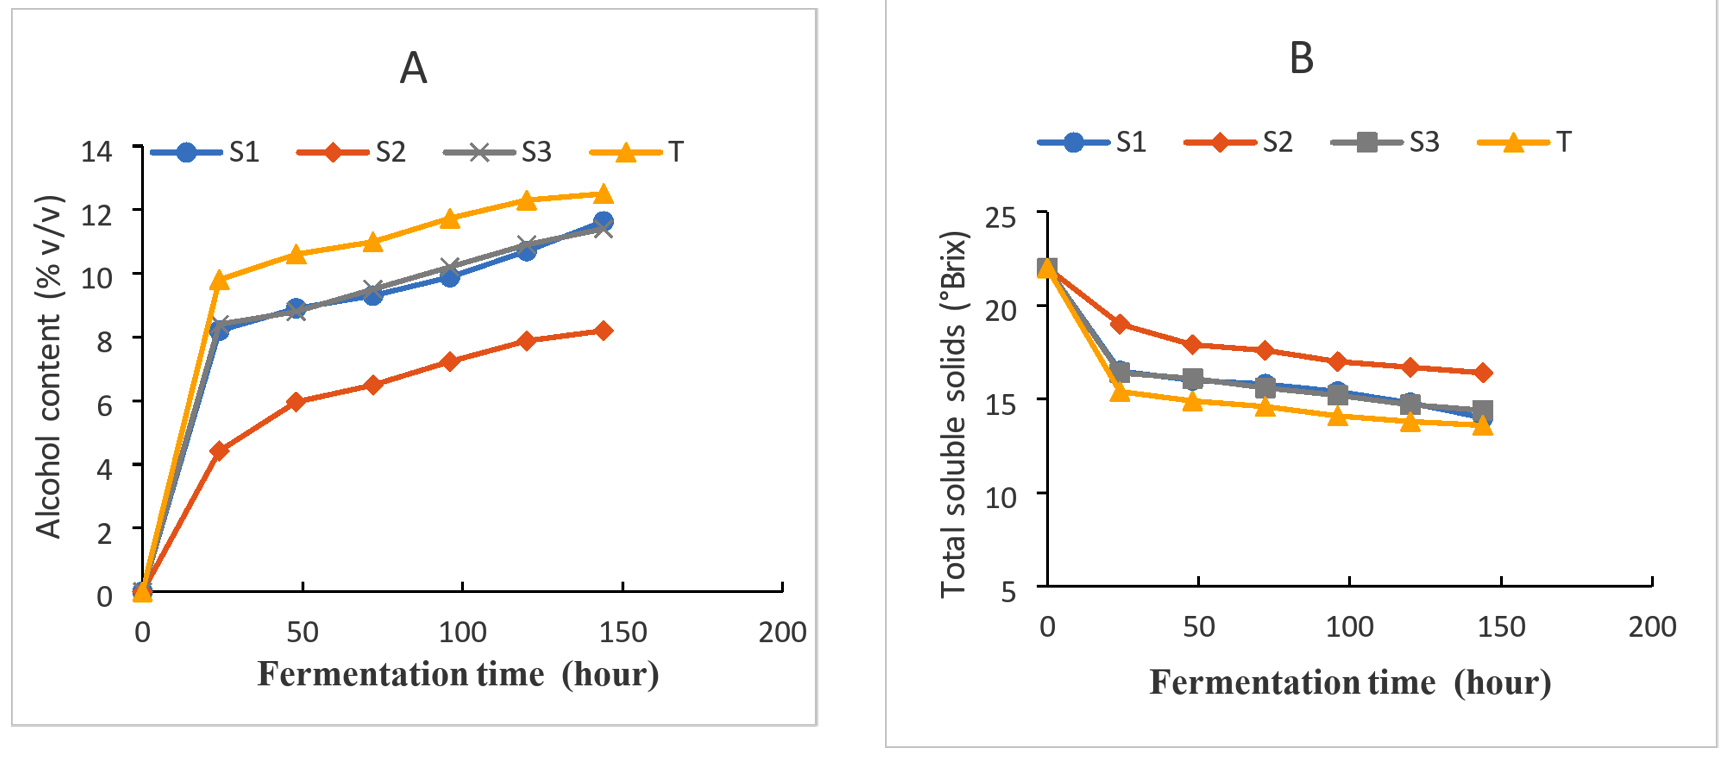
Figure 3. Changes in alcohol content (A) and the total soluble solids (B) during the course of fermentation
Evolution of pH and specific gravity during fermentation
The results of the evolution of the pH and specific gravity of the wort during fermentation are displayed in Figure 4. The analysis of these results shows that during fermentation, the evolution of these parameters follows a kinetic pattern of two stages: an acceleration phase and a slowdown phase. This kinetic pattern can be associated with the growth of fermentative microorganisms which, on some compound medium rich in carbohydrates, achieve growth. These fermentative microorganisms break down the substrate with the production of alcohol or acidic metabolites that lead to a drop in pH and specific density.34 These results also indicate that fermentation activity also depended on the types of strains obtained. Wine’s density was found to have decreased. The presence of fermentative yeasts utilized in winemaking may be the cause of this decline. Previous reports found that during fermentation, fruit wines’ density was decreased by yeasts like Saccharomyces cerevisiae, which was isolated from palm wine.38 The efficiency of Saccharomyces cerevisiae in winemaking was shown by this drop in wine density and the consequent rise in alcohol content.
The final pH values obtained are 3.8, 3.91, 3.88 and 3.71, respectively, for the (S1), (S2), (S3) and Control strains (Figure 4A). The final density of the musts also varies according to the different strains. For the four strains, it varies from 1.15 to 1.023 for (S1), 1.15 to 1.082 for (S2), 1.15 to 1.03 for (S3) and 1.15 to 1.011 for Control. The conversion of glucose to alcohol and the loss of mass in the form of CO2 may help to explain this (Figure 4B). Yeast metabolism is responsible for the must’s pH decrease and accompanying rise in titratable acidity during the aerobic and anaerobic fermentation phases. These also demonstrate the medium’s acidity throughout the fermentation process, which is essential to the creation of wine. Because it facilitates fermentation and improves the wine’s overall qualities and balance, acidity is a key factor in establishing wine quality. A poor fermentation will result from a lack of acidity.39
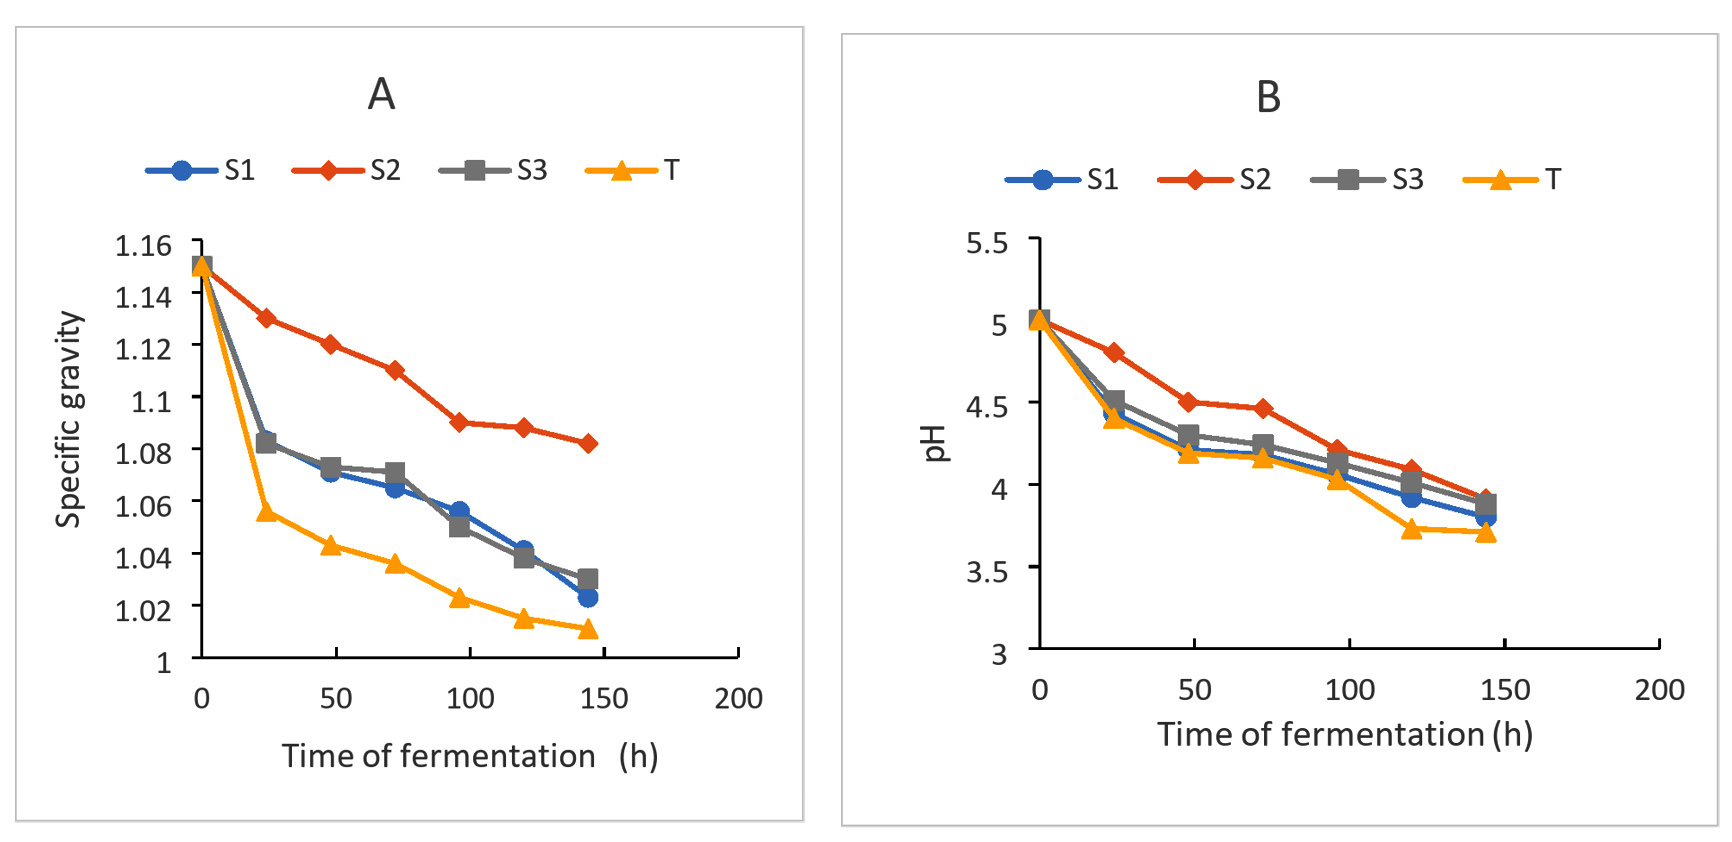
Figure 4. Evolution of the specific gravity (A) and pH (B) during fermentation
Effect of different stresses on yeast strains
Since the selected strains have shown their ability to carry out alcoholic fermentation, we then evaluated their ability to resist the various stressors including high concentrations of sugars, ethanol, pH and aggressive temperatures.
Stump growth at different temperatures
The results of the growth of yeast strains at different temperatures cultured on liquid media are presented in Figures 5A, 5B, 5C. In general, the growth of the three strains (S1), (S2) and (S3) studied is optimal at 30 °C (mesophilic) compared to the control strain. Thus, the OD ratio after 24 h of culture for the strains is between 5.03 and 7.84 at 25 °C while it is 5.45-10.08 at 30 °C, 4.49-8 at 35 °C and 2.32-4.44. After 72 h of cultivation of the same strains, the rates increase to 7.63-16.9; 9.6- 18.81; 8.19- 15.75 and 4.71-10.89, respectively, at 25 °C, 30 °C, 35 °C and 40 °C. Of all the strains, two have a high ratio at 30 °C compared to the control strain. These are the (S1) and (S3) strains. Moreover, at 40 °C, the ratio of the strains is very low after 24-72 h of culture Figure 5. The survival and growth of starts are significantly influenced by temperature. It is actually one of the factors that regulates how quickly microbes grow.40 stress that it is essential to the operation of alcoholic fermentation since it affects viability, growth, ethanol production, and conversion efficiencies. An analysis of these yeasts’ development at various temperatures revealed that two of them 30 °C and 35 °C performed best. These two numbers fall inside the range of temperatures that are ideal for yeast development. In fact,41 state that the ideal temperature range for yeast cultivation is between 30 °C and 35 °C, although the present range is between 25 °C and 30 °C. 42 emphasized the robust growth of yeast at 37 °C, which is near 30 °C. The fluidity of the plasma membrane would be higher at 37 °C than at other temperatures because the yeast cell uses assisted diffusion to carry sugar.
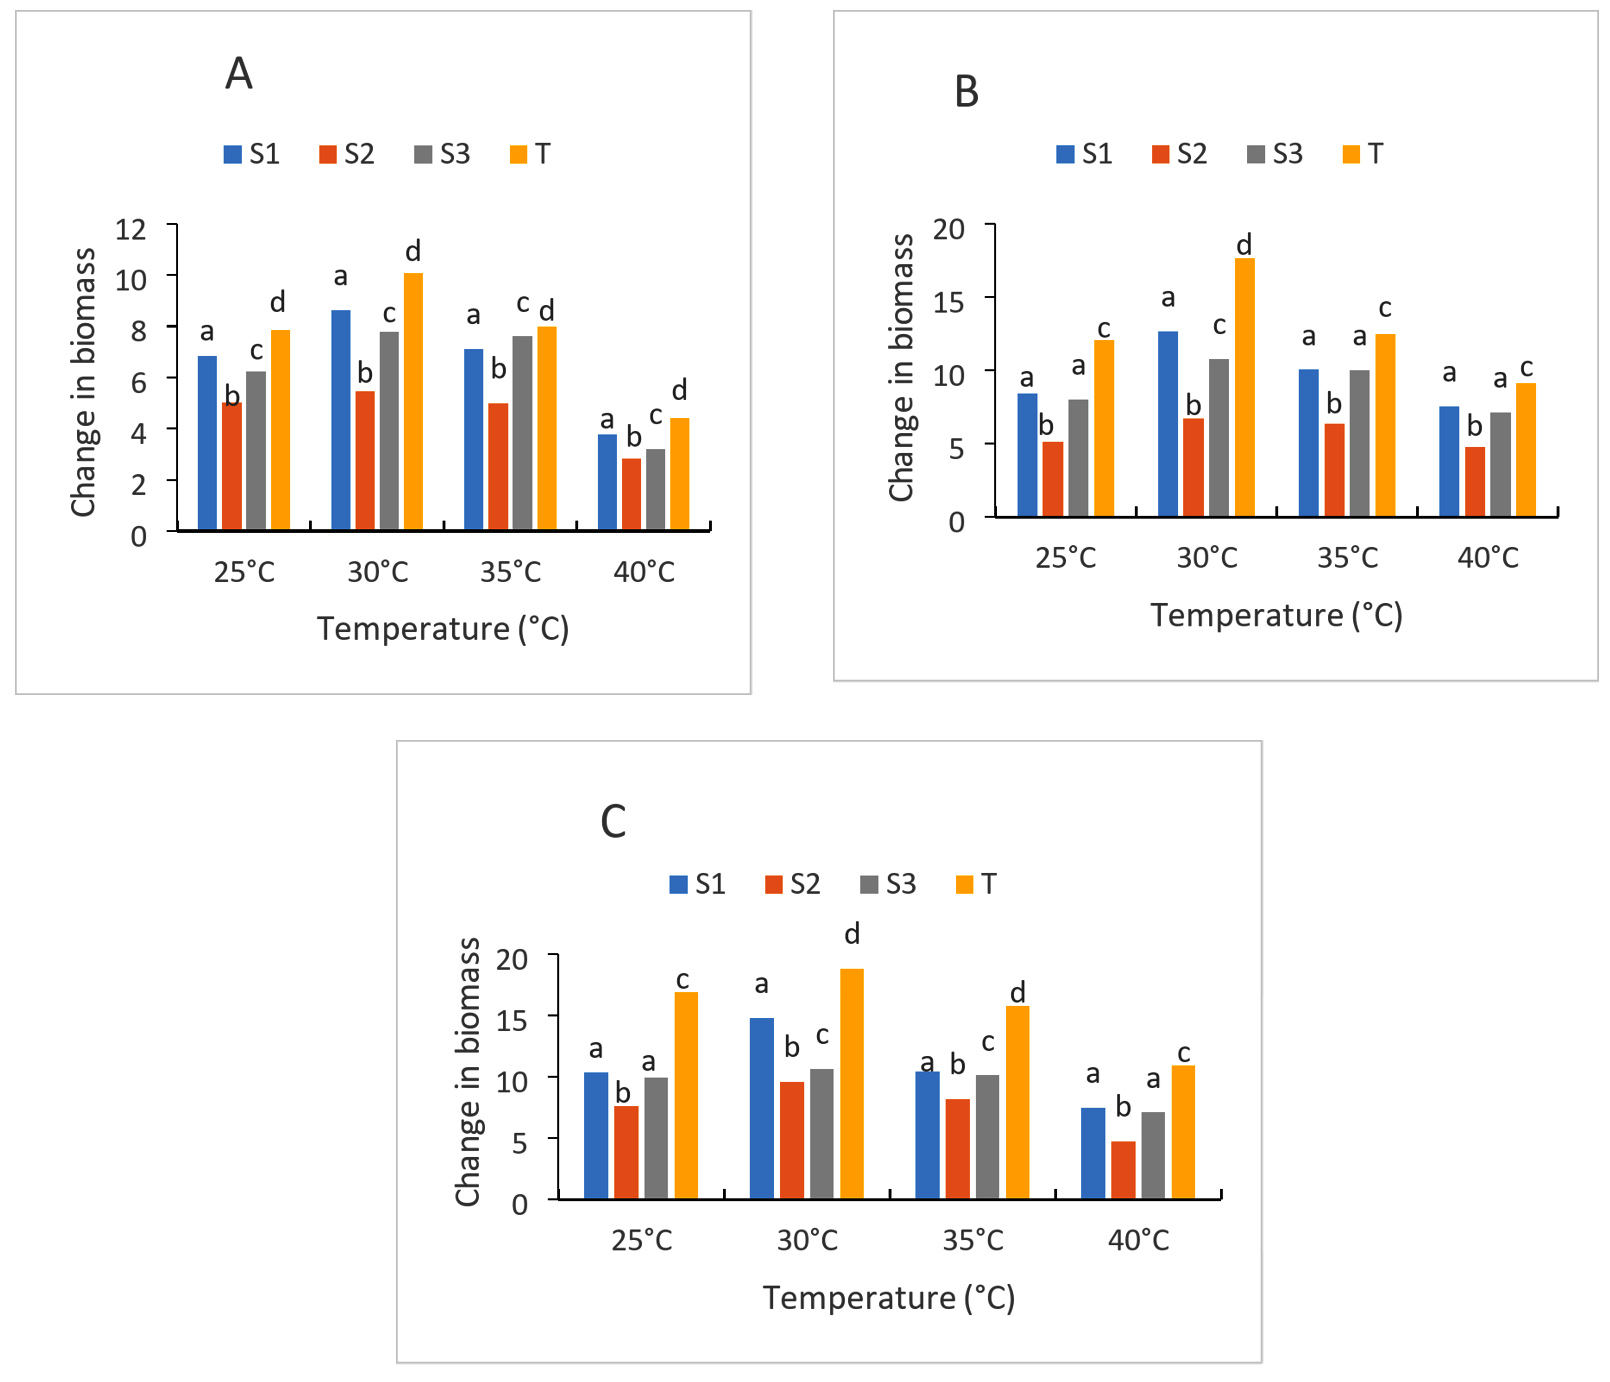
Figure 5. Strain growth at different temperature after 24 h (A), 48 h (B) and 72 h (C) of culture; S1: Candida tropicalis; S2: no identify strain; T: control strain (Saccharomyces cerevisiae); S3: Debaromyces nepalensis
Growth of selected strains at different ethanol levels
The growth of the strains with varying initial ethanol concentrations is depicted in Figures 6A, 6B, and 6C. In general, a decrease in growth is recorded for all strains above 16 (%v/v) of ethanol. However, these decreases vary by strain. Culture with strain (S2) is the medium where the greatest decrease is observed, regardless of the ethanol content. Thus, the rate goes from 5.88, 5.23, 4.66, 2.55, 0.99 for ethanol contents 8%, 12%, 16%, 20%, 24%, respectively, after 24 h of cultivation. While with the other strains, the levels drop from 8.9 to 1.2 and 7.54 to 2.46 for the (S1) and (S3) strains respectively for the same ethanol concentrations (Figure 6). After 72 h of culture of the same strains, the rates drop from 10.11 to 0.88 for (S1); 9.99 to 1.99 for (S3); 6 to 0.85 for (S3) and 10.66 to 2.78 for the control strain for the same ethanol concentrations. The ability of all strains to develop in the presence of 8%, 12%, and 16% initial ethanol rate, which translates into reasonably strong growth, was generally demonstrated. It is evident that when the concentration of ethanol rises, the concentration of biomass falls. High ethanol concentrations, for instance, would prevent strain expansion. Using 8% and 16% ethanol (v/v) at 30 °C resulted in noticeably greater viable cell counts for strains S1 and S3.43 Observed similar outcomes when assessing the impact of temperature and ethanol concentration on yeast cell viability. Initially, the yeasts were exposed to 11% ethanol at 30 °C, followed by 20% ethanol at 16 °C. When compared to the strain control, the viability of all the chosen yeasts was noticeably reduced at 20% and 24% ethanol at 30 °C. Depending on the strain types, the growth of the tested starters was hindered to varying degrees by all of the tested ethanol concentrations. The fact that all of the ethanol concentrations examined are higher than the maximum concentration at which yeast growth entirely ceases may help to explain these findings. Actually, ethanol’s mechanism of toxicity has two limiting doses.44 Ethanol has been recognized for many years to impede the growth and fermentation of several yeasts.45 Additionally, it was shown that the composition of the plasma membranes was crucial to the ethanol tolerance of yeast strains. Yeast increased the unsaturation index and, consequently, the fluidity of their membranes in a dose-dependent way in response to increased ethanol concentration.46 According to some reports, the membrane barrier becomes more permeable as the ethanol concentration rises.47 In fact, phospholipids and ethanol create weaker hydrogen bonds than they do with water. These changes lead to a change in the insertion process of some proteins, which necessitates the creation of hydrogen bonds, and an increase in membrane fluidity with more frequent lipid motions (lateral diffusion and rotation).
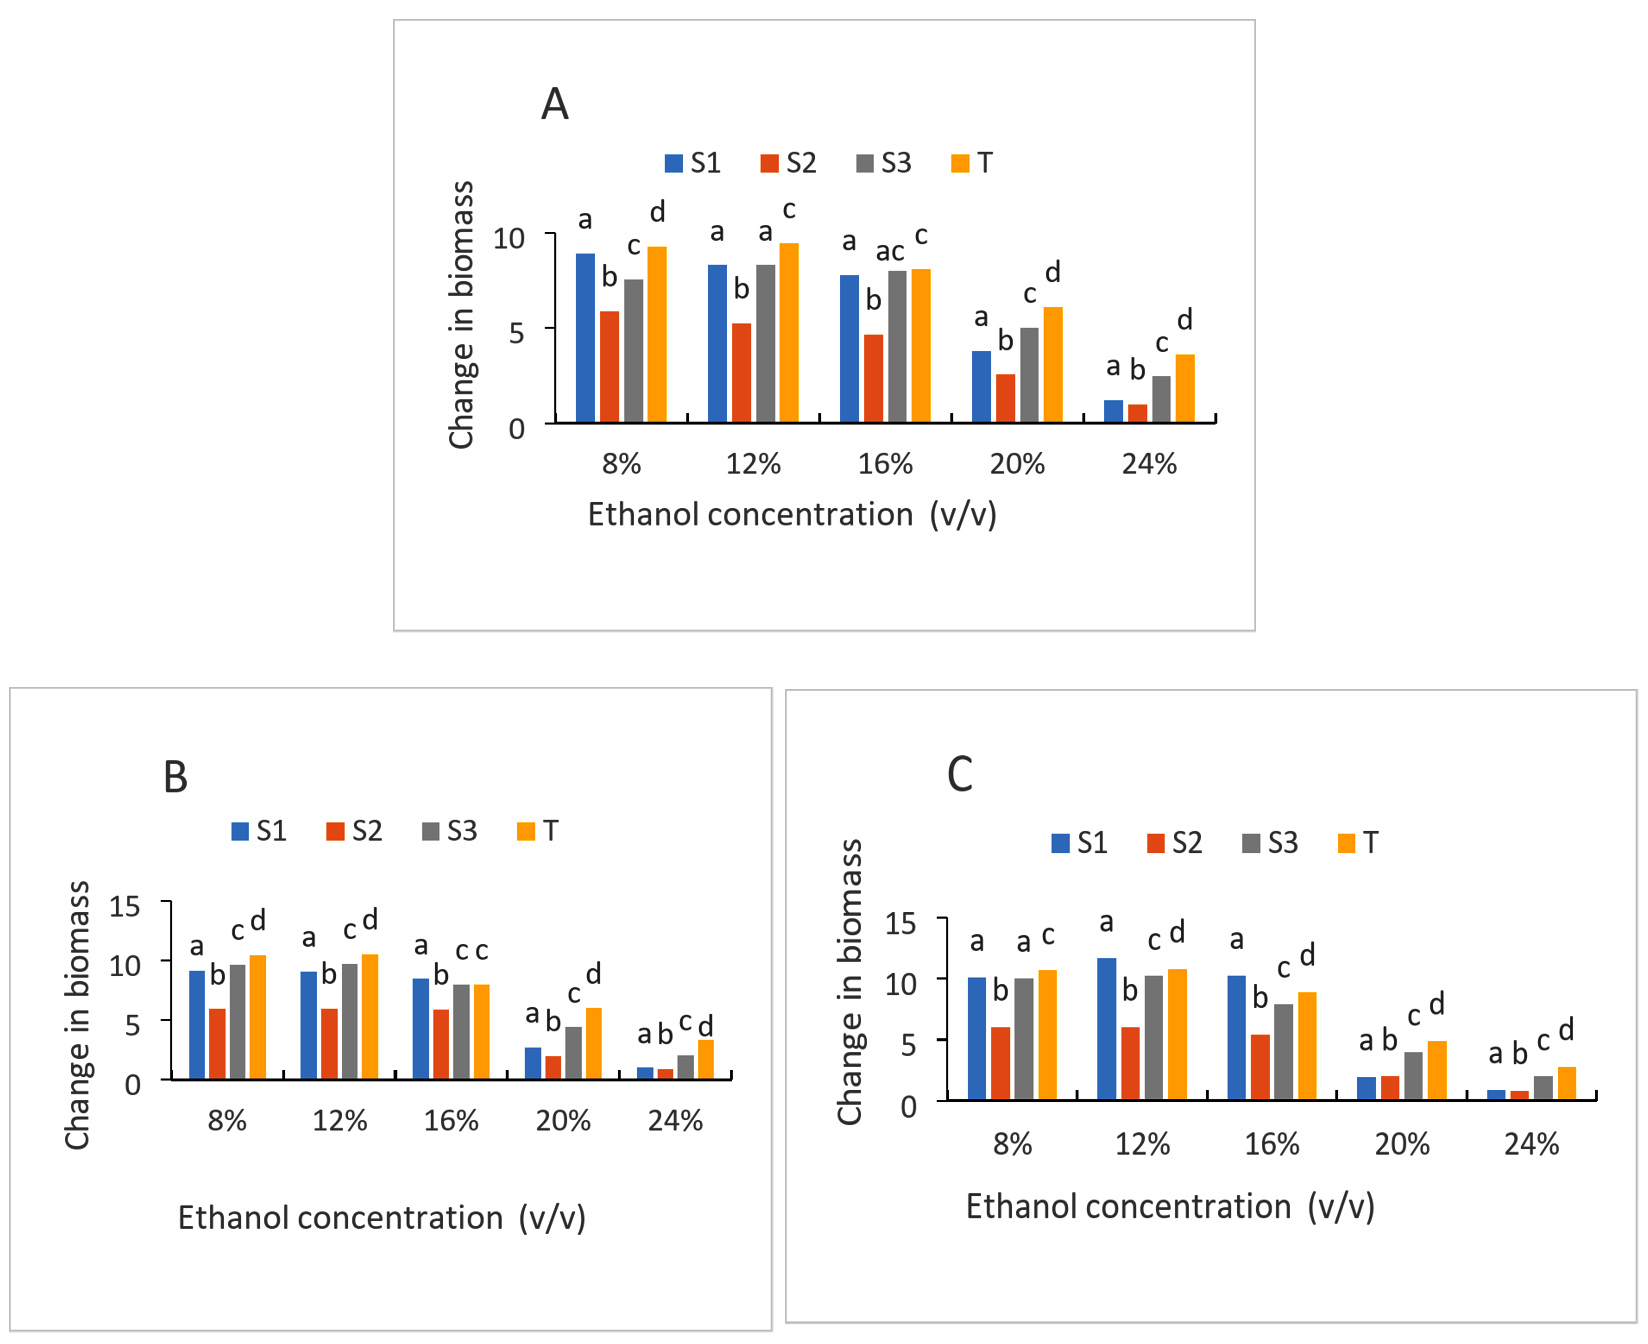
Figure 6. Growth of strains at different ethanol concentration after 24 h (A), 48 h (B) and 72 h (C) of culture; S1: Candida tropicalis; S2: no identify strain; T: control strain (Saccharomyces cerevisiae); S3: Debaromyces nepalensis
Growth of selected strains at different glucose concentrations
The strains’ development in the presence of varying glucose concentrations is depicted in Figure 7. In general, there is an increase in the biomass of the different strains as a function of glucose concentration and incubation time. This increase in biomass is a testament to the use of glucose by the strains for their growth. However, growth is influenced by different glucose contents. Thus, in the presence of 18% glucose, the biomass concentrations for the different strains are 10.24; 6.45; 9.76; 10.56 respectively for (S1); (S2); (S3); Control strain for 24 hours of incubation. At 30% glucose, these concentrations are between 12.99, 9.78, 12.88, 13.6, respectively, for even strains and incubation. At 72 hours of incubation, biomass concentrations increased relatively (11.63; 6.98; 10.3; 11.33) respectively for the (S1), (S2), (S3), control strain at 18%. At 30% glucose, the biomass concentration is (13.2, 8.87, 12.5, 12.8) for the same strains after 72 hours of incubation. In general, as the glucose concentration increases, so does the biomass concentration. Thus, the different glucose concentrations tested promoted the growth of the different selected strains. The three yeasts’ cellular viability was examined at 30 °C in relation to the effects of osmotic stress caused by rising Brix (18, 21, 24, 27, and 30). Taking into account the climatic circumstances during the alcoholic fermentation, the 30 °C and Brix range of 18 to 30 were not particularly stressful. If it weren’t for the grapefruit juice fermentation, 30 °C and 30°Brix may be regarded as typical oenological environmental conditions. The ability of yeast to focus their metabolic pathways on the production of proteins involved in the resistance mechanism controls the phenomena of resistance to osmotic stress.
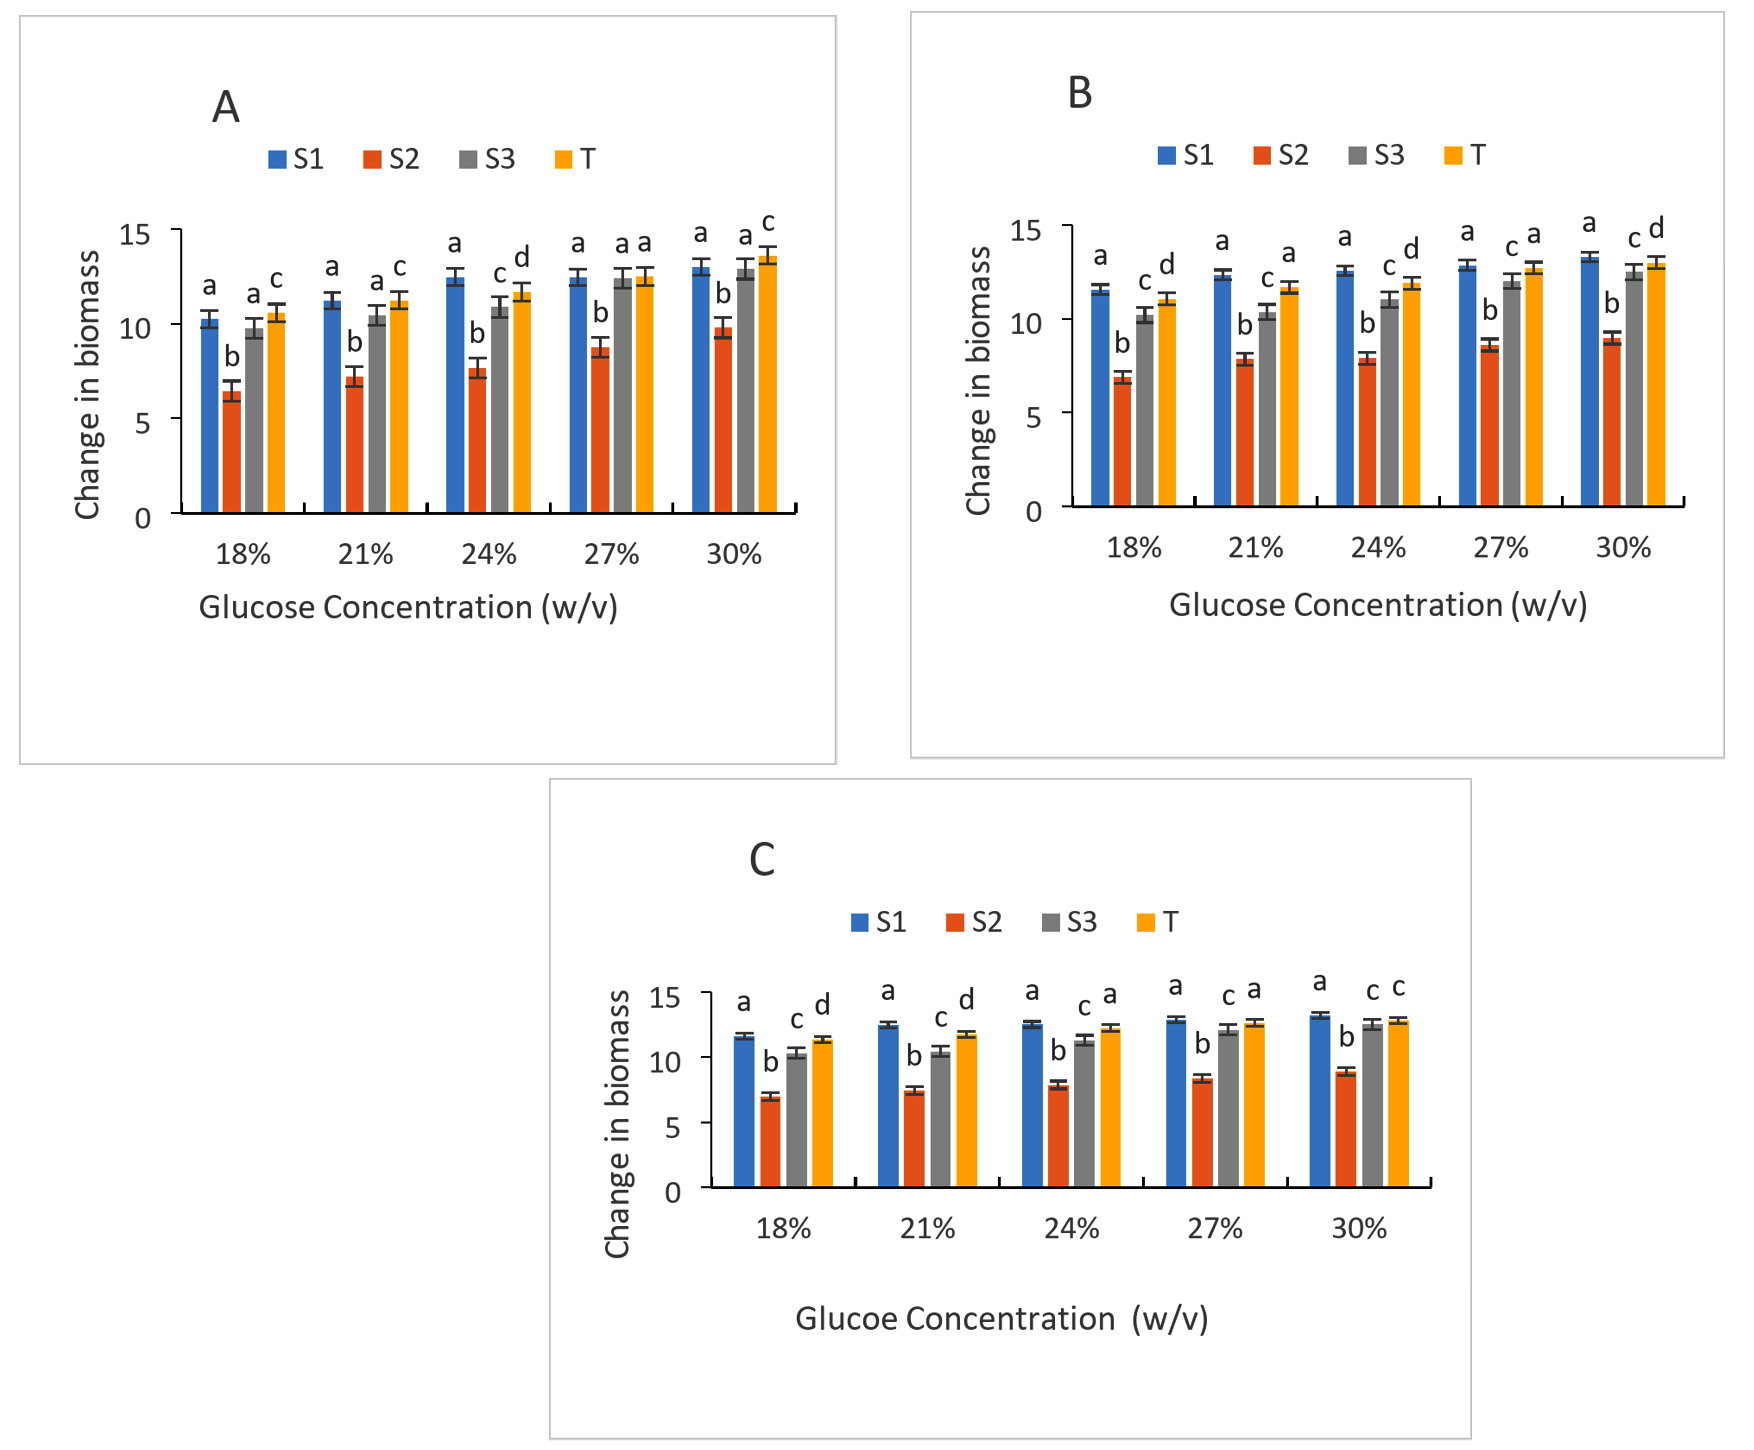
Figure 7. Growth of strains at different glucose level after 24 h (A), 48 h (B) and 72 h (C) of culture; S1: Candida tropicalis; S3: Debaromyces nepalensis; S2: no identify strain; T: control strain (Saccharomyces cerevisiae)
In fact, Saccharomyces cerevisiae cells respond to abrupt changes in high osmolality conditions by temporarily upregulating the expression of genes Msn2p and Msn4p that defend against oxidative stress. These two genes’ products have been identified as the transcription factors that control how well yeast cells respond to osmotic stress.48
Selected strains’ growth at various pH values
Figure 8 displays the strains’ development at various starting pH values. In general, an increase in growth is recorded for all strains regardless of pH and incubation times. In comparison to the control strain, which had a value of 11.13 after a 24-hour incubation period, (S1) and (S3) had the highest biomass, with values of 8.48 and 7.82, respectively. While strain (S2) had the lowest biomass value of 5.7 for the same incubation time. It should be noted that biomass growth is maximum between pH 3, 4 and 5 for all strains and for all incubation times (24 h, 48 h and 72 h) (Figure 8). On the other hand, at pH 6 and 8, growth decreased regardless of the strains and incubation time. The (S1) strain had the highest biomass value of 8.68 and 8.53 respectively for pH 6 and 8, followed by (S3) which has a biomass of 8.49 and 8.44 respectively for the same pH values at for an incubation time of 72 h. Every strain that was examined was able to thrive at each of these various pH levels. But (S2) showed low growth at initial pH. While (S1) and (S3) gave better biomass growth for most of the pH studied. The growth of our starter cultures was unaffected by any of the pH tests. In fact, some of these pH values fall within the range that yeasts can tolerate, which is between 3 and 4 and between 6 and 8, while others fall within the ideal pH range for yeast growth, which is between 3.5 and 4. The ability of the yeast cell to maintain a constant ratio between intracellular and extracellular hydrogen ion concentrations is known to be indicated by acidification power, which also shows glycolytic activity. In fact, it has to do with the yeast strains’ ability to survive and ferment.49 The results of fermentation test showed that mains of starters have high fermentative power. Indeed, at low extracellular pHs, organic acids present in the environment can enter the cell by passive diffusion. Inside, they dissociate due to the increased pH. Consequently, protons are exported, requiring energy in the form of ATP, which cannot be used for growth.
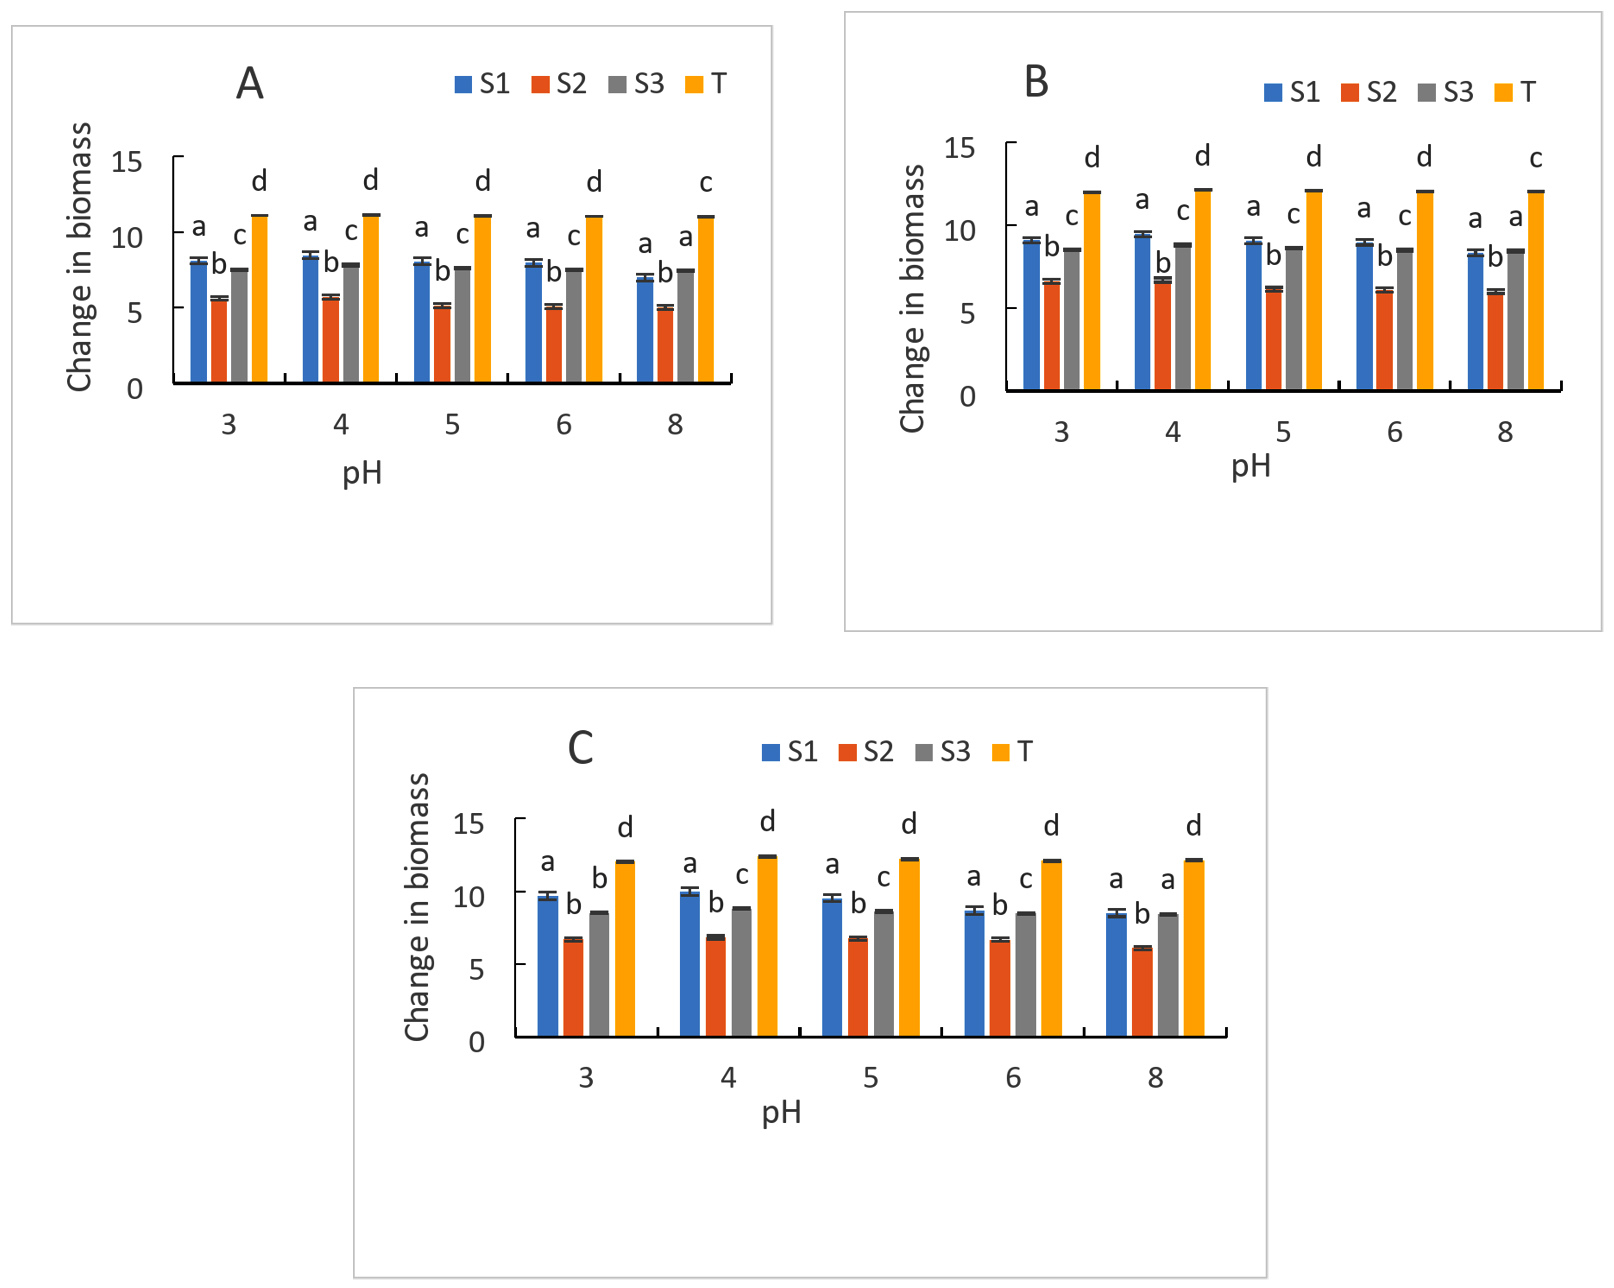
Figure 8. Growth of strains at different pH after 24 h (A), 48 h (B) and 72 h (C) of culture. S1: Candida tropicalis; S2: noidentify strain; S3: Debaromyces nepalensis; T: control strain (Saccharomyces cerevisiae)
Physicochemical analysis of the ‘’Must’’ and ‘’final wines’’
Due to longer fermentation and storage times, the pH values of the must and the resulting wine, W1 (3.50-3.08), W3 (3.50-3.04), and WT (3.50-3.15), dropped from the first to the seventh day (Table 4). The pH is lowered by lactic acid bacteria, which transform carbohydrates into organic acids. A more acidic environment results from the accumulation of lactic and acetic acids as they grow. Pyruvate is created when LAB starts glycolysis, and this is subsequently transformed into lactic acid. The pH reduction may also be caused by other acidic substances like formic or acetic acid. The growth medium’s buffering capabilities and the availability of fermentable carbohydrates both affect the pH drop. Acidosis, a detrimental health consequence that impairs food absorption and promotes tumor cell survival, can be brought on by low-pH beverages. Maintaining a regulated pH level is essential since low pH also impedes energy production, cell repair, and heavy metal detoxification. A good pH balance may be maintained and acidity can be countered by consuming alkaline foods and drinks, such as fruits and vegetables.50
The wine’s titratable acidity on the seventh day of fermentation was 1.63 to 1.81 (g/100 mL), which was far lower than what had been previously documented (Table 4). Nonetheless, a prior study demonstrated that titratable acidity ranged from 1 g/L to 1.03 g/L.51 In alcoholic beverages, acidity and pH are closely related, with pH denoting acidity. These factors are crucial for determining flavor, preservation, microbiological stability, and overall quality, and by managing them, manufacturers may create beverages with the best possible taste, texture, and shelf life.52
A much smaller range of 9.2-11.8 for total soluble solids (TSS) was found by our research. The study shows that variations in the total soluble solids in beverage samples significantly affect the final product’s flavor and quality. (TSS) are crucial to producing high-quality wine. The way the yeast cells use the carbohydrates determines the wines’ final TSS. (TSS) impacts sweetness, acidity, and overall flavor balance.53
Throughout the process of fermentation, the dry matter steadily decreased. In W1, W3, and WT, the dry matter content varied from 12.30 to 11.15; 12.13 to 11.18; and 12.36 to 10.08, respectively (Table 4). The accumulation of organic matter, which has the potential to increase during fermentation due to microbial multiplication, may be the cause of the decrease in dry matter content as fermentation duration increases.53
The study indicated no appreciable change in the temperature of the produced wine, with maximum and minimum recorded temperatures of 28.90 °C and 28.50 °C, respectively, Table 4 and quality potential. Brewers are able to avoid off flavors and ruined batches by continuously monitoring and controlling the temperature during the fermentation process. In order to minimize interruptions, increase shelf life, and produce consistent, high-quality products, proper temperature control is essential. Temperature control system investments are worth the money since they enhance product quality, boost customer happiness, and maybe boost sales.53
Table (4):
Chemical Parameters of the Must and Final wines
| Type of wine | Physicochemical parameters | |||||||||
|---|---|---|---|---|---|---|---|---|---|---|
| pH | Titratable acidity (g/100 mL) | Brix (°B) | Dry matter (%) | Temperature (°C) | Alcohol (% v/v) | Carbohydrates (g/100 mL) | Protein content (g/100 mL) | Ascorbic acid (mg/100 mL) | ||
| W1 | Must | 3.50 ± 0.02a | 1.44 ± 0.02a | 30 ± 0.1a | 12.30 ± 1.02a | 26.61 ± 0.05a | 0 ± 0a | 3.0 ± 0.03a | 0.42 ± 0.01a | 12.17 ± 0.10a |
| Wine | 3.08 ± 0.02b | 1.75 ± 0.02b | 11.8 ± 0.2b | 11.15 ± 0.95b | 28.60 ± 0.32b | 13.16 ± 0.21d | 1.2 ± 0.02b | 0.11 ± 0.02b | 6.38 ± 0.12b | |
| W3 | Must | 3.50 ± 0.01a | 1.34 ± 0.015a | 30 ± 0.02a | 12.13 ± 0.45a | 26.61 ± 0.05a | 0 ± 0a | 3.05 ± 0.02a | 0.41 ± 0.12a | 12.05 ± 0.56a |
| Wine | 3.04 ± 0.01b | 1.81 ± 0.04b | 10.80 ± 0.14b | 11.18 ± 0.53b | 28.50 ± 0.33b | 13.40 ± 0.06d | 1.18 ± 0.01b | 0.15 ± 0.02b | 7.11 ± 0.22b | |
| WT | Must | 3.50 ± 0.01a | 1.38 ± 0.02a | 30 ± 0.00a | 12.36 ± 0.58a | 26.6 ± 0.05a | 0 ± 0a | 3.04 ± 0.06a | 0.43 ± 0.03a | 12.18 ± 0.76a |
| Wine | 3.15 ± 0.01b | 1.63 ± 0.04b | 9.2 ± 0.28b | 10.08 ± 0.64b | 28.90 ± 0.11b | 15.05 ± 0.07b | 1.01 ± 0.04b | 0.13 ± 0.01b | 4.43 ± 0.01b | |
The mean (n = 3) ± standard deviations are used to express the results. Within the samples of the same formulation of wine, mean values in the same column followed by the same letter (a, b) are not statistically significant (p > 0.05). W1 (Grapefruit wine inoculated with the starter Candida tropicalis); W3 (Grapefruit wine inoculated with Debaromyces nepalensis ST); WT (Grapefruit wine inoculated with strain control Saccharomyces cerevisiae)
Table 4 reports the changes in alcoholic content and shows that the fermented samples had a higher alcoholic content. After fermentation for seven days, the sample fermented with Candida tropicalis and Debaromyces nepalensis had the lowest alcoholic content, 13 (%v/v), whereas the sample fermented with Saccharomyces cerevisiae had the highest, 15.05 (%v/v). These figures fall within the ranges found in previous studies, which were between 4.0% and 11.5% (%v/v) and 2.7% and 21.7%.54 The progressive increase in alcohol level of high-quality wine is attributed to the inclusion of sugar, which keeps the beverage’s acidity while also raising its alcohol content. Longer fermentation times give yeast more time to convert sugars to alcohol, which increases the alcohol content in high-quality fruit wines.55
Table 4 displays the variations in total sugar. For all fermented wines, the total sugar content dropped from 3.03 to 3.05 mg/100 mL at day 0 to 1.01 to 1.18 mg/100 mL by the time the seven-day fermentation phase is over. When the fermentation period lengthened from day 0 to day 7, the samples’ total sugar dropped significantly (p > 0.05). As the fermentation process went on, sugar broke down into carbon dioxide and ethanol, which is why the concentration of total carbohydrates decreased. Compared to samples taken from other regions of Ethiopia, our wine samples have a reduced mean total carbohydrate content.56,57
The total protein content of the grapefruit juice fermented by particular yeast isolates is displayed in Table 4. From the first to the seventh day of fermentation, the total protein steadily decreased. It was 0.11 mg/100 mL for the Candida tropicalis-fermented wine, 0.15 mg/100 mL for the Debaromyces nepalensis-fermented wine, and 0.13 mg/100 mL for the Saccharomyces cerevisiae-fermented control wine. According to previous reports, there is probably no reason to be concerned about excessive protein accumulation from consuming fruit because the grapefruit has a modest level of total protein.58 Microbial cell growth is another potential explanation for the reduced total protein content of the wine sample. Fermentation may cause a decrease in free amino acids, microbial metabolites, and total nitrogen content, or it may be the result of the fermentative organisms reducing proteolytic enzymes.59
The ascorbic acid content of the different samples decreased steadily between days 0 and 9, ranging from 12.17 to 6.38 mg/100 mL for the Candida tropicalis-fermented sample, 12.05 to 7.11 mg/100 mL for the Debaromyces nepalensis-fermented sample, and 12.18 to 4.43 mg/100 mL for the Saccharomyces Cerevisiae-fermented control wine (Table 4). Ascorbic acid is a key antioxidant for organisms and food matrixes. It is involved in hydroxylation processes, bone and blood development, and the manufacture of corticoids and catecholamines.60
Microbial analysis of the must and produced wine
Table 5 lists the microbial loads, which include fungi, coliforms, lactic acid bacteria, aerobic spore-forming bacteria, and aerobic mesophilic bacteria.
All wine samples showed a notable decrease in total aerobic mesophilic bacteria day seven of fermentation. The mean values of aerobic mesophilic bacteria of the wines samples were ranging between (2.5 ± 0.7)104 – (1 ± 0.1)102 cfu/mL, (11.5 ± 0.2)104 – (9.50 ± 0.3)102 cfu/mL and (3.2 ± 0.5)103 – (2.5 ± 0.7)102 cfu/mL respectively for the wines samples W1, W2, and WT. The low pH, high acidity, and high alcohol content of the wines may account for these findings since they are known to inhibit the growth of pathogens and provide fermenting yeast a competitive edge in the natural environment.61,62
In every wine sample that is made, the amount of lactic acid bacteria drops. First day (day 0), the concentration was (1.5 ± 0.70)102 cfu/mL for W1, (2.4 ± 0.7)102 cfu/mL for W2 and (3.5 ± 0.7)102 for WT. In contrast, none of these microorganisms wasn’t observed on day 7 in all wine samples. The mean yeasts load fluctuated between (12.5 ± 0.07)105 to (5 ± 0.07)102 cfu/mL, (10.5 ± 0.07)105 to (4 ± 0.7)102 cfu/mL and (25 ± 0.35)106 to (10 ± 0.23)102 in the samples W1, W3 and WT, respectively. The significant drop in sugar content may be the result of the yeast cells’ quick and efficient use of the sugar present in the must, which causes the must to ferment. At the same time, an increase in the alcohol content will also have an impact on the rate of yeast growth, as reported by earlier researchers.36 The effective use of the available sugars and the daily aeration of the fermenting wort, which encourages their propagation and quick multiplication, are responsible for the high load of yeast cells observed at the start of fermentation. Since alcohol and carbohydrates are the sources of nutrition for the growth of lactic acid bacteria and fungus, the decrease in these microorganisms during fermentation may be caused by the increase in alcohol concentration. According to previous reports, concentrations ranging from 8% to 18% (v/v) decrease in growth speed, cell viability, and metabolic activity.20
None of the wine samples showed signs of aerobic spore-forming bacterial growth. Moreover, there were no viable coliform cells in any of the wines. These microbes’ absence suggests that the wine was made aseptically and is safe for ingestion. To ensure a high fermentation yield and the long-term stability of the entire fermentation process, the fermentation was conducted under aseptic conditions. The synthesis of antimicrobial compounds including organic acids, bacteriocins, and hydrogen peroxide by some LAB species, which causes the fermentation broth to become acidic, may be linked to the absence of coliform bacteria and Enterobacteriaceae.63,64
Due to their economic benefits, wine industry is showing increasing interest in microbial strains that have the capacity to resist potentially aggressive environmental stresses. Finding new natural yeast strains with technological capabilities that set them apart from similar strains already exploited in the wine business was the aim of this study. Among the isolates obtained, only strains (S1) and (S3) were shown to be highly capable of transforming fermentable sugars into ethanol relative to other strains isolated from local products. These strains were able to grow adequately at higher than normal temperatures and to resist stressful ethanol concentrations and osmotic pressures compared to baker’s yeast used as a reference strain. We can conclude that the isolated strains (S1) and (S3) are suitable for use in the production of fruit wine. Future studies aimed at their conservation for the production of freeze-dried starters should be considered.
ACKNOWLEDGMENTS
The authors would like to thank the Biotechnology Research and Training Laboratory of Ahmadu Bello University, Zaria, Nigeria, and the Inqaba Biotech Laboratory, Ibadan, Nigeria for the Technical Assistance during the PCR experiments and DNA Sequencing.
CONFLICT OF INTEREST
The authors declare that there is no conflict of interest.
AUTHORS’ CONTRIBUTION
All authors listed have made a substantial, direct and intellectual contribution to the work, and approved it for publication.
FUNDING
None.
DATA AVAILABILITY
All datasets generated or analyzed during this study are included in the manuscript.
ETHICS STATEMENT
Not applicable.
- Sawadogo-Lingani H, Owusu-Kwarteng J, Glover R, Diawara, Jakobsen M, Jespersen L. Sustainable production of African traditional beers with focus on Dolo, a West African sorghum-based alcoholic beverage. Front Sustain Food Syst. 2021;5:672410.
Crossref - Adebo J A, Njobeh PB, Gbashi S, et al. Fermentation of cereals and legumes: Impact on nutritional constituents and nutrient bioavailability. Fermentation. 2022; 8(2):63.
Crossref - Greppi A, Rantsiou K, Padonou W, et al. Determination of yeast diversity in ogi, mawe, gowe and tchoukoutou by using culture-dependent and-independent methods. Int J Food Microbiol. 2013;165(2):84-88.
Crossref - Petrova P, Petrov K. Lactic acid fermentation of cereals and pseudocereals: Ancient nutritional biotechnologies with modern applications. Nutrients. 2020;12(4):1118.
Crossref - Sionek B, Szydlowska A, Kucukgoz K, Kolozyn–Krajewska D. Traditional and new microorganisms in lactic acid fermentation of food. Fermentation. 2023;9(12):1019.
Crossref - Peyer LC, Zannini E, Arendt E K. Lactic acid bacteria as sensory biomodulators for fermented cereal-based beverages. Trends Food Sci Technol. 2016;54:17-25.
Crossref - Adewara AO, Ogunbanwo ST. Effects of processing variables on the production of ‘Burukutu’, a Nigerian fermented beverage. Nat Sci. 2013;11(1):16-28.
- Amorim, JC, Schwan RF, Duarte WF. Sugar cane spirit (cachaca): Effects of mixed inoculum of yeasts on the sensory and chemical characteristics. Food Res Int. 2016;85:76-83.
Crossref - Viera-dalode G, Madode YE, Houhouigan J, Jespersen L, Jakobsen M. Use of starter cultures of lactic acid bacteria and yeast as inoculum enrichment for the production of gowe, a sour beverage from Benin. Afr J Microbiol Res. 2008;2(7):179-186.
- Mugula JK, Nawhus JA, Sorhaug T. Use of starter cultures of lactic acid bacteria and yeasts in the preparation of togwa, a Tanzanian fermented food. Int J Food Microbiol. 2003;83(3):307-318.
Crossref - N’guessan FK, Coulibaly HW, Alloue-Boraud MWA, Cot M, Dje KM. Production of freeze-dried yeast culture for the brewing of traditional sorghum beer, tchapalo. Food Sci Nutr. 2015;4(1):34-41.
Crossref - Lucking R, Aime MC, Robbertse B, Mille AN, et al. Unambiguous identification of fungi: where do we stand and how accurate and precise is fungal DNA barcoding?. IMA Fungus. 2020;11(1):14.
Crossref - Chibi S, El Hadi D. The isolation and characterization of yeast strains Saccharomyces cerevisiae cultivated on musts of common dates: Physiological studies of the adaptation and the resistance to ethanol. Alger J Environ Sci Technol. 2019;5(2).
- El Khaider K, Chafik I, Hamouda A, et al. Selection of mixed starters for the preparation of traditional Moroccan bread. Journal of Biological Research. 2023;96(1):1-23.
Crossref - Zainab A, Amos Y, Datsugwai MSS, Mathew B. Quality assessment of watermelon (Citrullus lanatus) wine produced using Saccharomyces cerevisiae isolated from palm wine. J Biomater. 2018;2(2):65-73.
- White TJ, Bruns T, Lee S J, et al. Amplification and direct sequencing of fungal ribosomal RNA genes for phylogenetics. PCR Protocols: A Guide to Methods and Applications. 1990;18(1):315-322.
Crossref - Nilsson RH, Larsson KH, Taylor AF, et al. The UNITE database for molecular identification of fungi: handling dark taxa and parallel taxonomic classifications. Nucleic Acids Res. 2019;47(1):259-264.
Crossref - Ayanniran AI, Abiodun S, Lachance MA. Biochemical and molecular characterization of yeasts isolated from Nigerian traditional fermented food products. Afr J Microbiol Res. 2020;14(9):481-486.
Crossref - Yamaoka C, Kurita O, Kubo T. Improved ethanol tolerance of Saccharomyces cerevisiae in mixed cultures with Kluyveromyces lactis on high-sugar fermentation. Microbiol Res. 2014;169(12):907-914.
Crossref - da Silva RO, Batistote M, Cereda MP. Alcoholic fermentation by the wild yeasts under thermal, osmotic and ethanol stress. Braz Arch Biol Technol.2013;56(2):161-169.
Crossref - Cappello MS, Bleve G, Grieco F, Dellaglio F, Zacheo G. Characterization of Saccharomyces cerevisiae strains isolated from must of grape grown in experimental vineyard. J Appl Microbiol. 2004;97(6):1274-1280.
Crossref - AOAC. Official methods of analysis,Association of Official Analytcal Chemists, Washington, DC, USA, 18th Edition. 2010.
- Kitessa DA, Bacha K, Tola YB, Murimi M, Gershe S, Guta M. Microbial quality and growth dynamics in shameta: a traditional Ethiopian cereal-based fermented porridge. Fermentation. 2022;8(3):124.
Crossref - Biri HB, Pan O G, Yahaya MM, Ezeribe A. Wine from water melon juice using palm wine yeast isolate. Int J Res Eng Sci. 2015;3(1):35-40.
- Thiex N. Evaluation of analytical methods for the determination of moisture, crude protein, crude fat, and crude fiber in distillers dried grains with solubles. Journal of AOAC international. 2009;92(1):61-73.
- Albalasmeh AA, Berhe AA, Ghezzehei TA. A new method for rapid determination of carbohydrate and total carbon concentrations using UV spectrophotometry. Carbohydr Polym. 2013;97(2):253-261
Crossref - Ayalew M, Demissew M. Optimization of drying temperature and time in Gesho ”Rhamuns Prinoide“ leaf powder processing as hop substitute in commercial beer brewing industries. J Food Sci Hyg. 2017;1(1):1-11.
- AOAC. Official methods of analysis,Association of Official Analytcal Chemists, Rockville, MD, USA, 17th Edition. 2000.
- Kurtzman CP, Fell JW, Boekhout T, Robert V. Methods for isolation, phenotypic characterization and maintenance of yeasts. The Yeast (Fifth Edition) .2011:87-110.
Crossref - Attchelouwa CK, N’guessan FK, Ake FM, Dje MK. Molecular identification of yeast, lactic and acetic acid bacteria species during spoilage of tchapalo, a traditional sorghum beer from Cote d’Ivoire. World J Microbiol Biotechnol. 2018;34:1-10.
Crossref - Pratama A, Gumilar J, Putranto WS, Rukayadi Y. Isolation, Identification, and Characteristics of Local Yeast Isolates with Proteolytic Capability Obtained from Traditional Processed Indonesian Duck Eggs. J Pure Appl Microbiol. 2024;18(3):1566-1579
Crossref - Kumar S, Gummadi SN. Osmotic adaptation in halotolerant yeast, Debaryomyces nepalensis NCYC 3413: role of osmolytes and cation transport. Extremophiles. 2009;13:793-805.
Crossref - Jimoh SO, Ado SA, Ameh JB, Whong CMZ. Characteristics and diversity of yeast in locally fermented beverages sold in Nigeria. World J Eng Pure Appl Sci. 2012;2(2):40-44.
- Piame LT, Kaktcham PM, Kouam EMF, et al. Technological characterisation and probiotic traits of yeasts isolated from Sha’a, a Cameroonian maize-based traditional fermented beverage. Heliyon. 2022; 8(10):1-11.
Crossref - Awe S, Nnadoze SN. Production and Microbiological Assessment of Date Palm (Phoenix dactylifera L.). British Microbiol Res J. 2015;8(3):480-488.
Crossref - Panda SK, Sahu UC, Behera SK, Ray RC. Bio-processing of bael [Aegle marmelos L.] fruits into wine with antioxidants. Food Bioscience. 2014;5:34-41.
Crossref - Yabaya A, Bobai M, Adebayo LR. Production of wine from fermentation of Vitis vinifera (grape) juice using Saccharomyces cerevisiae strain isolated from palm wine. International Journal of Information Research and Review. 2016);3(10):2834-2840.
- Hu TM, Gavahian M, Pradhan R, Lu SY, Chu YL. Functional, antioxidant, and sensory properties of mixed fruit (pitaya, watermelon, and mint) and pitaya wines. Food Sci Nutr. 2023;11(6):3442-3449.
Crossref - Yadav DK, Chand K, Kumari P. Effect of fermentation parameters on physicochemical and sensory properties of Burans wine. Systems Microbiology and Biomanufacturing. 2022;2(2):380-392.
Crossref - Varize CS, Bucker A, Lopes LD, et al. Increasing ethanol tolerance and ethanol production in an industrial fuel ethanol Saccharomyces cerevisiae strain. Fermentation. 2022;8(10):470.
Crossref - Bhuiyan MNI, Raiyaan KR, Afrin S, Nahid M. Effect of the temperature and osmotic stress on the growth and cell viability of Candida maltosa. Bangladesh Journal of Scientific and Industrial Research. 2023;58(2):71-78.
Crossref - N’Guessan FK, N’Dri DY, Camara F, Dje MK. Saccharomyces cerevisiae and Candida tropicalis as starter cultures for the alcoholic fermentation of tchapalo, a traditional sorghum beer. World J Microbiol Biotechnol. 2010;26(4):693-699.
Crossref - Okeke BC, Agu KC, Uba PO, et al. Wine production from mixed fruits (pineapple and watermelon) using high alcohol tolerant yeast isolated from palm wine. Univers J Microbiol Res. 2015;3(4):41-45.
Crossref - Ma M, Liu ZL. Mechanisms of ethanol tolerance in Saccharomyces cerevisiae. Appl Microbiol Biotechnol. 2010;87(3):829-845.
Crossref - Lin Y, Zhang W, Li C, Sakakibara K, Tanaka S, Kong H. Factors affecting ethanol fermentation using Saccharomyces cerevisiae BY4742. Biomass Bioenergy. 2012;47:395-401.
Crossref - Yao S, Hao L, Zhou R, Jin Y, Huang J, Wu C. Co-culture with Tetragenococcus halophilus improved the ethanol tolerance of Zygosaccharomyces rouxii by maintaining cell surface properties. Food Microbiol. 2021;97:103750.
Crossref - Li B, Liu N, Zhao X. Response mechanisms of Saccharomyces cerevisiae to the stress factors present in lignocellulose hydrolysate and strategies for constructing robust strains. Biotechnology for Biofuels and Bioproducts. 2022;15(1):28.
Crossref - de Nadal E, Posas F. The HOG pathway and the regulation of osmoadaptive responses in yeast. FEMS Yeast Res. 2022;22(1):foac013.
Crossref - Guo ZP, Olsson L. Physiological responses to acid stress by Saccharomyces cerevisiae when applying high initial cell density. FEMS Yeast Res. 2016;16(7):fow072.
Crossref - Tekle B, Jabasingh SA, Fantaw D, et al. An insight into the Ethiopian traditional alcoholic beverage: Tella processing, fermentation kinetics, microbial profiling and nutrient analysis. Lwt. 2019;107:9-15.
Crossref - Nemo R, Bacha K. Microbial, physicochemical and proximate analysis of selected Ethiopian traditional fermented beverages. Lwt. 2020;131:109713.
Crossref - Gebremichaela WM, Abayb KH, Sbhatub DB, Berhe GG, Gebreyohannes G. Process standardization and characterization of Mies: Ethiopian honey wine. Heliyon .2024;10(20):1-14
Crossref - Shen D, Shi H, Wu C, Fan G, Li T. Evaluation of proximate composition, flavonoids, and antioxidant capacity of ginkgo seeds fermented with different rice wine starters. J Food Sci. 2020;85(12):4351-4358.
Crossref - Wedajo LB. Microbiology of Ethiopian traditionally fermented beverages and condiments. Int J Microbiol. 2020;2020(1):1478536.
Crossref - Alemayehu HG. Physico-chemical characterization of commercial local alcohol beverages available in south nations, nationalities and People’s regional state, Ethiopia. Int J ChemTech Rese. 2018;11(8):227-231.
Crossref - Berhanua M, Desalegna A, Birria DJ, Ashenafi M, Tigu F. Microbial, physicochemical and proximate analysis of Tej collected from Amhara regional state of Ethiopia. Heliyon. 2023;9(6):1-9
Crossref - Nkhata SG, Ayua E, Kamau EH, Shingiro JB. Fermentation and germination improve nutritional value of cereals and legumes through activation of endogenous enzymes. Food Sci Nutr. 2018;6(8):2446-2458.
Crossref - Elema TB, Olana BN, Elema AB, Gemede HF. Indigenous processing methods, physical properties and proximate analysis of fermented beverage of honey wine booka in Gujii, Ethiopia. J Nutr Food Sci. 2018;8(2):1000669.
Crossref - Ajogun CO, Achinewhu SC, Kiin-Kabari DB, Akusu OM. Physicochemical, sensory and microbiological quality of table wine produced from coconut water, honey and zobo. Eur J Agric Food Sci. 2020;2(5).
Crossref - Phillips KM, Tarrago-trani MT, Gebhardt SE, et al. Stability of vitamin C in frozen raw fruits and vegetable homogenates. J Food Comp Anal. 2010;23:23-29.
Crossref - Assunca R B, Mercadante AZ. Carotenoids and ascorbic acid composition from commercial products of cashew apple (Anacardium occidentale L.). J Food Compost Anal. 2003;16(6):647-657.
Crossref - Santos RTS, Biasoto ACT, Rybka ACP, et al. Physicochemical characterization, bioactive compounds, in vitro antioxidant activity, sensory profile and consumer acceptability of fermented alcoholic beverage obtained from Caatinga passion fruit (Passiflora cincinnata Mast.). Lwt. 2021;148:111714.
Crossref - Chilaka CA, Uchechukwu N, Obidiegwu JE, Akpor OB. Evaluation of the efficiency of yeast isolates from palm wine in diverse fruit wine production. Afr J Food Sci. 2010;4(12):764-774.
- Bayoi JR, Vandi Y, Foundikou BY, Etoa FX. Traditional processing, physicochemical property, phytochemical content, and microbiological and sensory quality of the yellow “Tea Lemi” wine made in the Far-North of Cameroon. Journal of Food Quality. 2021;2021(1):664747.
Crossref
© The Author(s) 2025. Open Access. This article is distributed under the terms of the Creative Commons Attribution 4.0 International License which permits unrestricted use, sharing, distribution, and reproduction in any medium, provided you give appropriate credit to the original author(s) and the source, provide a link to the Creative Commons license, and indicate if changes were made.