

ISSN: 0973-7510
E-ISSN: 2581-690X
Chronic wounds pose a substantial challenge to the global healthcare system. Despite the development of diverse treatments targeting various aspects of wound healing, the formidable obstacle of polymicrobial biofilm consortia persists. The biofilm matrix comprises EPS (Extracellular Polymeric Substances), mainly contains proteins, carbohydrates and eDNA (Extracellular DNA). It offers numerous advantages to microorganisms within the biofilm. The objective of this study was to evaluate the ability of bacteria isolated from wound infections to form biofilm using various methods and to analyze the composition of their EPS within the biofilm. Bacteria were isolated from wound swabs and identification was done by MALDI-TOF MS. Biofilm production was determined with the Congo red agar (CRA), crystal violet staining and microtiter plate methods. The genes involved in biofilm formation such as icaA and clfA, were detected through PCR analysis. EPS components were measured at different incubation times, with carbohydrates quantified by phenol-sulfuric acid method, proteins determined by the Lowry method, and eDNA analyzed through agarose gel electrophoresis. All bacteria showed the ability of biofilm formation and were distinguished as strong, moderate or weak biofilm makers. In the EPS, carbohydrate content increased after 72 hours of incubation, protein content was highest after 48 hours, and eDNA levels were highest after 72 hours of incubation. This study highlighted that biofilm-forming bacteria express various molecules in their EPS at different time intervals and hold promise for advancing our understanding of structural changes of biofilm and architectural integrity and functionality of matrix components.
Extracellular DNA (eDNA), Congo Red Agar, Microtiter Plate, PCR, Lowry Method
Cuts, minor wounds and burns are unpreventable events of life. A wound typically involves skin breakage, tissue damage and may be of open or closed type. In closed wounds, unexposed damaged tissues get repaired without or with a lesser degree of interference that contamination brings. In open wounds, the broken protective body surface (skin or mucous membrane) allows the entry of foreign material to the tissue. Normally, the wound healing process involves four stages: hemostasis, inflammation, proliferation, and remodeling. All these phases must occur in a specific order and within appropriate timeframes for proper healing to take place.1 Fail to proceed through these normal process leads to chronic wounds.2
The most common types of chronic wound include ulcers (e.g. venous, arterial, diabetic, pressure ulcers), infectious wounds, ischemic wounds, wounds from radiation poisoning etc.3 Because of their inability to heal in expected time, chronic wounds become important health concern over the past decades. It is often painful and impairs the quality of affected individual. These conditions create financial burden on both the patients and healthcare systems.
The processes of wound healing can be impacted by various factors such as medication, elderly age, obesity, certain medical conditions (diabetes, blood disorders, and respiratory diseases), poor nutrition and infections leading to chronic wounds.4 A significant factor in impaired healing process is the presence of polymicrobial communities, living collaboratively called biofilm.5 All chronic wounds typically contain microorganisms, which may be part of the patient’s normal flora or commensal organisms. In chronic wound, pathogenic and commensal bacteria co-aggregate to produces biofilm and maintain chronic infection.6 The research has shown that most of the chronic wounds consist of diverse microbial flora composed of Gram-positive bacteria including Enterococcus spp., Staphylococcus aureus, Gram-negative bacteria such as Acinetobacter spp., Pseudomonas aeruginosa, as we as fungi like Aspergillus spp., Candida spp., are all among the common pathogens.7
Development of biofilm in a wound is a very complex process and varies with species. However, the biofilm formation processes are having some common stages. The first stage involves attachment of free cells with the surfaces by using some physical interactions like Van der waal forces, steric interaction or electrostatic interactions or by bacterial appendages like pili, flagella.8 In the next stage, attached microbial cells start secreting matrix in the form of Extracellular Polymeric Substances (EPS) to make stable microbial mesh. EPS contain polysaccharides, proteins, eDNA which helps in microbial cell communication.9 In this stage, biofilm become multilayer forming a micro-colony of diverse microbial communities. Micro-colony enhances rate of molecules interchanges, circulation of metabolites along with elimination of waste byproducts. This is followed by maturation and cells in biofilms are adapted to the external changes. Lastly the biofilm start shredding and colonizing to the new surface.9 Biofilm causes complication by arresting healing process in inflammatory phase.5 Bacteria in biofilm are having various strategies to escape from host defense responses. They remain dormant and hidden in EPS matrix by adapting to the changing environment and nutritional conditions with changes in gene expression, protein synthesis and metabolism.10
EPS is crucial for establishing and maintaining the biofilm structure.11 Polysaccharides help in the attachment encoded by ica operon (icaABCD).12 It also protect from external stresses like host immune defense, anoxic condition or antimicrobial compounds.13 eDNA enables horizontal gene transfer.14 Functional interaction between polysaccharides, proteins and eDNA contributes to the properties of biofilm.15
Both Gram-positive and Gram-negative bacteria contribute to biofilm development. In contrast to their planktonic culture, metabolic activity get differ at biofilm scale.16,17 EPS components are responsible for various characteristics of biofilm.18 These components are inconsistent with both space and time. Different bacteria species shows different amount of EPS and the amount may changes with changes in internal and external factors.9 However, detailed information about the EPS components of polymicrobial biofilm is not well revealed. The effect of EPS synthesis and degradation on physicochemical properties of biofilm, bacterial behavior within the biofilm is not well understood. In this study, the biofilm-forming capabilities of bacteria, along with their EPS production at different time intervals was assessed. This study aims to investigate the biomolecules synthesized by different bacterial species during biofilm formation. Our findings reveal considerable differences with the phenotype and metabolic compositions among planktonic and biofilm-forming bacteria, providing insights into the mechanisms behind bacterial biofilm production. This study of biofilm development and matrix components offers valuable insights into structural changes, architectural integrity, and the functionality of the biofilm matrix. A deeper understanding of its complex composition could lead to more effective strategies for managing biofilm-associated infections.
Identification of bacteria from wound sample
Four clinical isolates were obtained from Bharati Hospital, Pune and identified using MALDI-TOF MS and MALDI Biotyper. Each culture was subcultured and maintained in nutrient agar media for further studies.
Biofilm Formation Assays
Congo red agar (CRA) method
Biofilm production was checked by inoculating bacterial isolates using CRA (Congo Red Agar) method. CRA media was prepared by supplementing BHI (Brain Heart Infusion) agar with Congo red (0.8 g/L). The plates were inoculated and incubated at 37 °C for 24 hours.19 Strong biofilm production was indicated by the appearance of dark black colonies having rough and dry surfaces. Intermediate producers are indicated by black colored colonies having a smooth and shiny surface or red colored colonies with a dry and rough consistency. Whereas red colonies having smooth and shiny consistency indicate the absence of biofilm formation.20
Crystal violet staining method
Staining with Crystal violet was used to assess the capacity of biofilm formation.20,21 Briefly, a loopful of overnight grown culture was added to 3 ml of trypticase soya broth (TSB) in test tubes and incubation was done at 37 °C for 24 hours. After incubation, content was decanted and tubes were washed with phosphate buffered saline (PBS) pH 7. The tubes were allowed to air dry at room temperature and then stained with 4% crystal violet. After draining the tubes upside down, a noticeable film lining the bottom and walls of the test tubes indicated presence of biofilm formation. Intensity of crystal violet stain is recorded which corresponds to the amount of biofilm formation.
Microtiter plate (MTP) method
The quantitative biofilm formation ability of all isolates were studied using 96 wells microtiter plate.22,23 Briefly, 5 ml of TSB containing test tubes were inoculated with 50 μL overnight grown culture. 200 μL of each bacterial culture was added to microtitre plate. The plates were incubated at 37 °C for 24 hours. Following the incubation, the media along with planktonic cells were poured out and adhered cells were cleaned by washing with 200 µL PBS. Plates were dried at room temperature. For biofilm fixation on the bottom of the well, 100 µL of 99% methanol was added in each well for 10 minutes. Methanol was discarded and allowed to dry. Then 150 µL of 0.1% aqueous solution of crystal violet was added to each well. The excess stain was rinsed off with PBS wash. The stain from the adhered cells was eluted by adding 150 µL of 30% acetic acid and measured the optical density at 570 nm. The experiment was conducted in triplicate and biofilm formation ability was calculated. For this, three standard deviations (SD) above the average of optical density (OD) of negative control were considered as ODc (optical density cut off). With this, bacteria were categorized as follows:
- Non-biofilm producer: OD≤ODc
- Weak biofilm producer: ODc<OD≤2×ODc
- Moderate biofilm producer: 2×ODc<OD≤ 4×ODc
- Strong biofilm producer: 4×ODc<OD22,24
Screening of biofilm associated genes using PCR
The presence of three biofilm-associated genes: icaA, icaA2 (intercellular adhesion gene) and clfA (clumping factor A) was examined using PCR. Crude DNA from all isolates was extracted using simple rapid boing method with some minor modifications.25 A Single freshly grown colony was suspended in 2-3 ml of TSB followed by incubation at 37 °C for 2-3 hours with vigorous shaking. Bacterial pellet was collected and suspend in 200 µL of TE buffer comprising 10 mM Tris-Cl pH 8.0 and 1 mM EDTA and boiled for 15 minutes, followed by immediate cooling on ice for 15 minutes. After centrifugation at 14,000 rpm for 5 minutes at room temperature, 5 µL of the supernatant was used for PCR amplification. Primers for icaA, icaA2 and clfA genes were designed based on previously published references.
For icaA following primers were used for amplification: 5’-CAGTATAA CAACATTCTATTGC-3’ as the forward primer and 5’-GAGAATTGATAAGAGTTCC-3’ as the reverse primer, which yield a PCR product of 132 bp.26 For icaA2 primers used were: 5’-GAGGTAAAGCCAACGCACTC-3’ as the forward primer and 5’-CCTGTAACCGCACCAAGTTT-3’ as the reverse primer, yielding a PCR product of 151 bp.27 For clfA gene following primers were used: 5’-CCGGATCCGTAGCTGCAGATGCACC-3’ as forward primer and 5’-GCTCTAGATCAC TCATCAGGTTGTTCAGG-3’ as reverse primer, giving a PCR product of 165 bp.28 The name of target genes, their primer sequences, product size and reference are shown in Table 1. The total volume of PCR reaction mixture was 25 µL containing 2 µL of template DNA, 1.0 µL of primers (0.5 µL of each forward primer and reverse primer), 12.5 µL of master mix (EmeraldAmp® GT PCR Master mix) and 9.5 µL of distilled water. DNA amplification was performed using thermocycler with following condition: denaturation in the initial step at 94 °C for 1 minute followed by 30 cycles of amplification where denaturation at 94 °C for 30 seconds, afterward annealing at 48 °C for 30 seconds and succeeded by extension at 72 °C for 1 minute. Ending the reaction with final extension at 72 °C for 2 min. The electrophoresis was done using 1.2% agarose gel containing ethidium bromide (0.5 µg/ml) and PCR results were seen under UV transilluminator.
Table (1):
Forward (F) and Reverse (R) primer sequences of genes used for PCR amplification
Gene |
Sequence of primer |
Product size in bp |
Ref. |
|---|---|---|---|
icaA |
F-CAGTATAACAACATTCTATTGC R-GAGAATTGATAAGAGTTCC |
132 |
26 |
icaA2 |
F-GAGGTAAAGCCAACGCACTC R-CCTGTAACCGCACCAAGTTT |
151 |
27 |
clfA |
F-CCGGATCCGTAGCTGCAGATGCACC R-GCTCTAGATCACTCATCAGGTTGTTCAGG |
165 |
28 |
Detection of Extracellular Polymeric Substances (EPS)
Analysis of exopolysaccharide production
Exopolysaccharide presence around the bacteria were identified by using Indian ink staining procedure.24 Overnight grown culture on CRA plate was wet mounted on slide and stained with Indian ink (10%) and examined under microscope. The transparent halo zone around the cell shows the presence of Exopolysaccharide.
Quantification of carbohydrate and protein
The bacterial isolates were inoculated in 3 ml TSB and incubated at 37 °C overnight. 80 µL of culture was inoculated into a glass dish (100 mm × 15 mm) with 20 ml fresh TSB medium and incubated for 24 hours, 48 hours and 72 hours at 37 °C. Following the incubation period, the supernatant was discarded to exclude floating cells. Sterile PBS (2-3 ml) was added to each plate. The biofilm was scraped and collected in sterile tubes and centrifuged at 12000 × g for 10 minutes at 4 °C.29 The supernatant was used as EPS sample for carbohydrate and protein estimation. Carbohydrates were estimated by phenol-sulfuric acid method30 with D-glucose as standard. For proteins quantification, Lowry method was used with bovine serum albumin as standrad.31 Further proteins were also visualized by SDS PAGE. For this purpose, proteins were first precipitated using 50% (w/v) TCA (Trichloroacetic acid). One part of 50% TCA was added to four parts of sample and then the mixture was kept at 4 °C for 10 minutes and centrifuged at for 14,000 rpm for 5 minutes. After two washes with 200 µL cold acetone, the pellet was air dried. Sample buffer consisting of SDS 10% (w/v), β-mercaptoethanol 10 mM (v/v), glycerol 20% (v/v), Tris HCl 0.2 M (w/v) pH 6.8, bromophenol blue 0.05% (w/v) was added to the pellet and boiled at 100 °C for 10 minutes. EPS sample was then loaded on 12% SDS PAGE gel.32 The gel was stained overnight with staining solution Commassie Brilliant Blue G-250 (2% (w/v) in 40% methanol (v/v) and 20% (v/v) acetic acid).
Detection of eDNA
For eDNA analysis, EPS sample obtained from above procedure was used. 5 µL of EPS sample was mixed with sample buffer and run on 1.2% agarose gel. After electrophoresis, gel was visualised by staining with ethidium bromide under UV light.33
Statistical analysis
A data was represented as the mean of three sets. Differences were analysed by one way ANOVA (Analysis of Variance) using Microsoft Excel.
Identification of bacteria by MALDI-TOF MS
The four bacteria isolated from wound sample were identified by MALDI-TOF (Figure 1 and Table 2) as: Staphylococcus aureus DSM 3463, Staphylococcus haemolyticus 10024 CHB, Pseudomonas aeruginosa ATCC 27853 THL, and Klebsiella pneumoniae ssp. ozaenae 9295_1 CHB.
Table (2):
Identification of bacterial isolates by comparison of the Bruker taxonomy database using Biotyper 3.1 software
Bacterial species identified |
Score |
|---|---|
Staphylococcus aureus DSM 3463 |
2.169 |
Staphylococcus haemolyticus 10024 CHB |
2.126 |
Pseudomonas aeruginosa ATCC 27853 THL |
1.912 |
Klebsiella pneumoniae 9295_1 CHB |
1.961 |
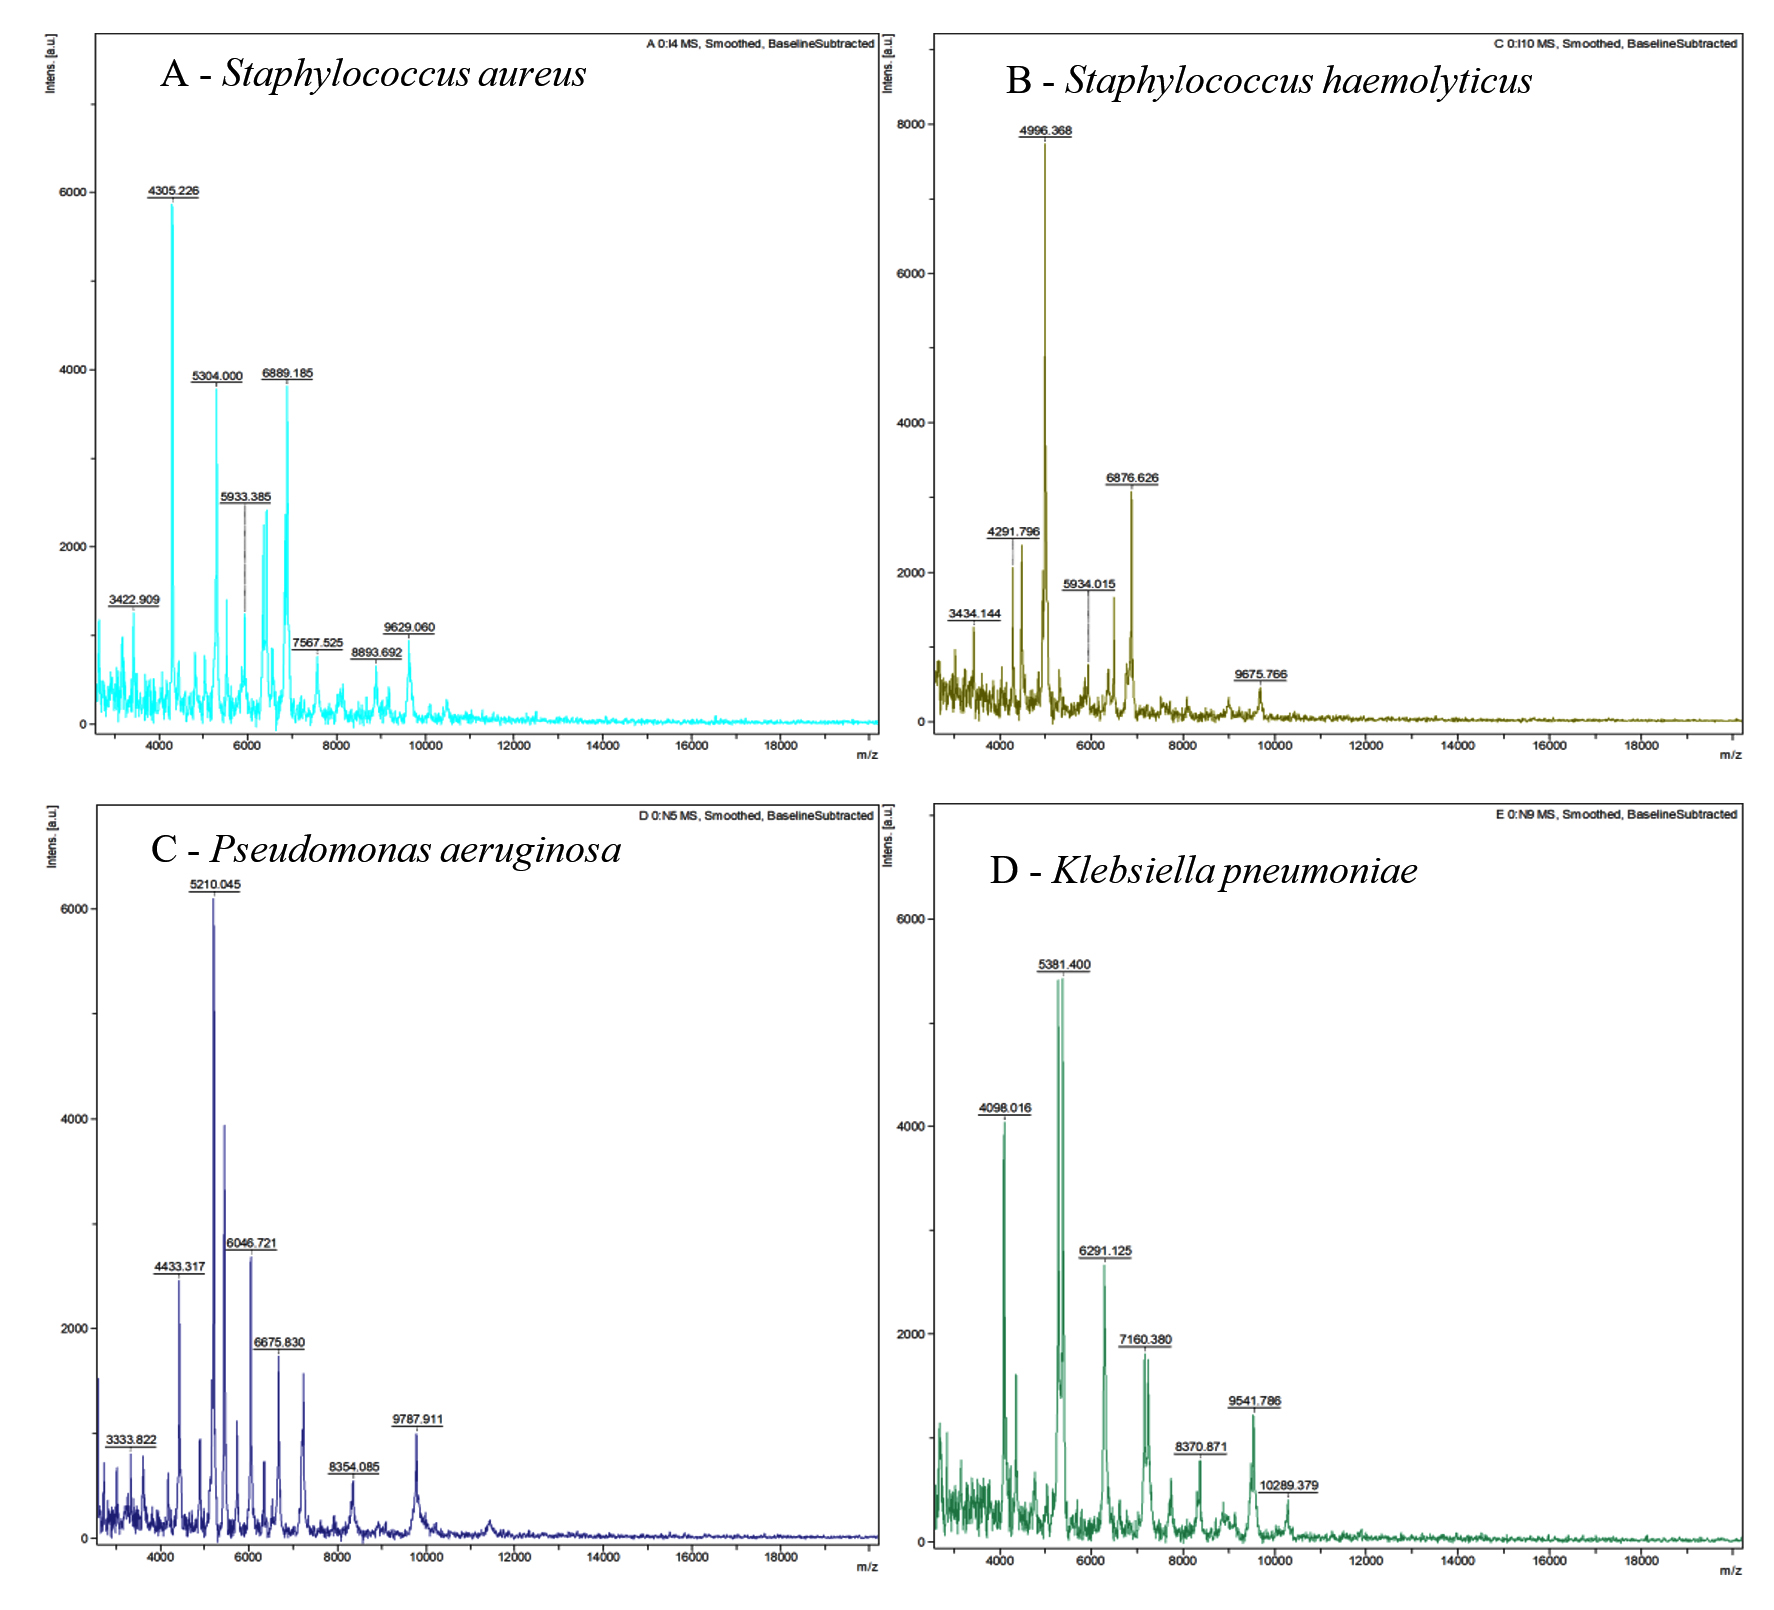
Figure 1. MALDI-TOF MS spectra of bacteria (A) Staphylococcus aureus (B) Staphylococcus hemolyticus (C) Pseudomonas aeruginosa and (D) Klebsiella pneumoniae
Biofilm formation assay
Biofilm formation assay for four selected bacterial isolates was done by using four different methods. All methods show biofilm formation by all isolates.
Congo Red agar (CRA) method
The biofilm formations by bacteria using CRA method are shown in Figure 2. Staphylococcus aureus and Klebsiella pneumoniae spp. shows black colour colonies with dry surface indicating strong slime producers. Whereas Pseudomonas aeruginosa shows dark red colony indicating intermediate slime producer and Staphylococcus hemolyticus shows red colony with smooth consistency indicating negative result for slime production.
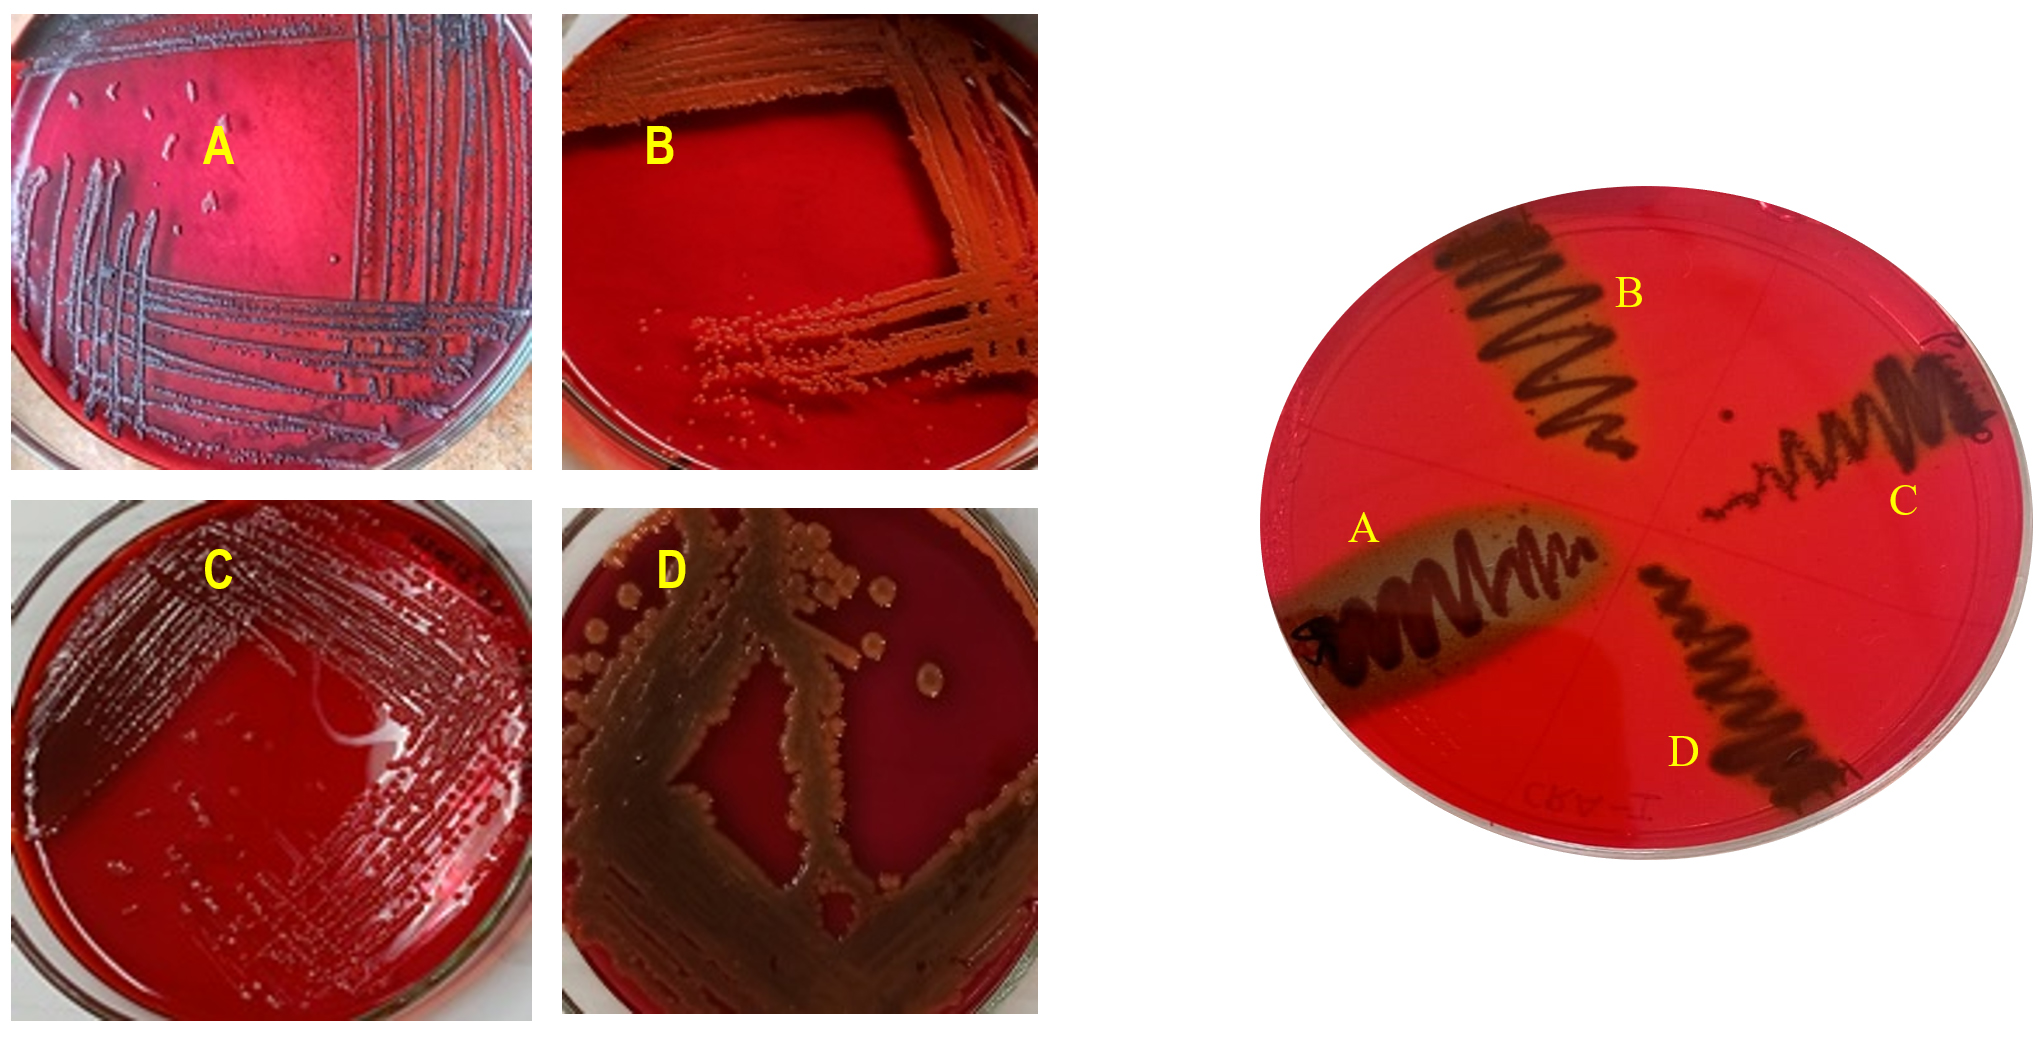
Figure 2. (i) CRA plates showing slime (biofilm) production with (A) S. aureus (B) S. hemolyticus (C) P. aeruginosa and (D) K. pneumoniae. (ii) CRA plate showing 4 isolates (A, B, C, D)
Crystal violet staining method
Using crystal violet stain method (Figure 3), S. aureus and K. pneumoniae shows biofilm attached to tube wall indicating strong biofilm producers. P. aeruginosa with moderate colour on tube wall indicate intermediate biofilm producer while less colour on tube wall indicates S. hemolyticus as weak biofilm producer.
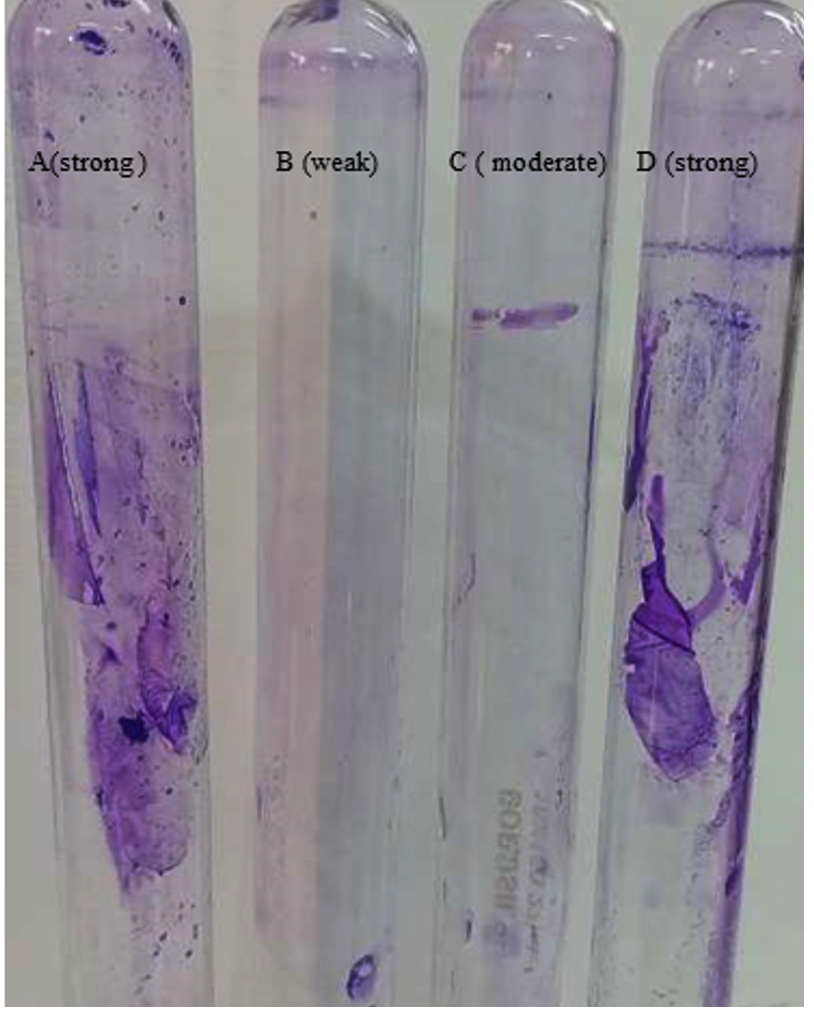
Figure 3. Crystal violet stain method showing tube A (S. aureus) as a strong, tube B (S. hemolyticus) as weak, tube C (P. aeruginosa) as a moderate and tube D (K. pneumoniae) as a strong biofilm producer
Microtiter plate method
As shown in Figure 4, all isolates were biofilm producers. S. aureus and S. hemolyticus were moderate biofilm producers, P. aeruginosa was weak biofilm producer and K. pneumoniae was strong biofilm producer as per color intensity. Biofilm production also shows variation with incubation times (Figure 5).
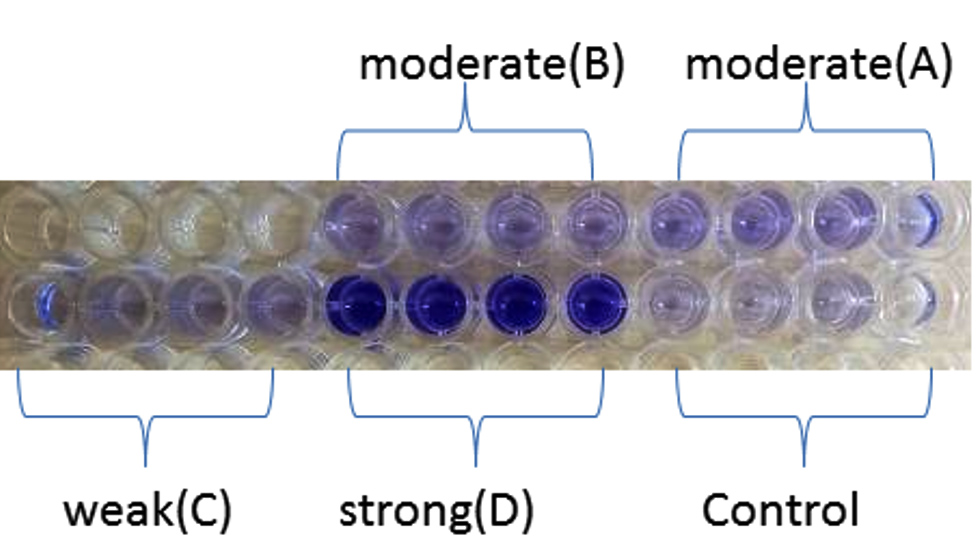
Figure 4. Microtiter plate method showing A (S. aureus) and B (S. hemolyticus) as moderate, C (P. aeruginosa) as weak and D (K. pneumoniae) as a strong biofilm producer
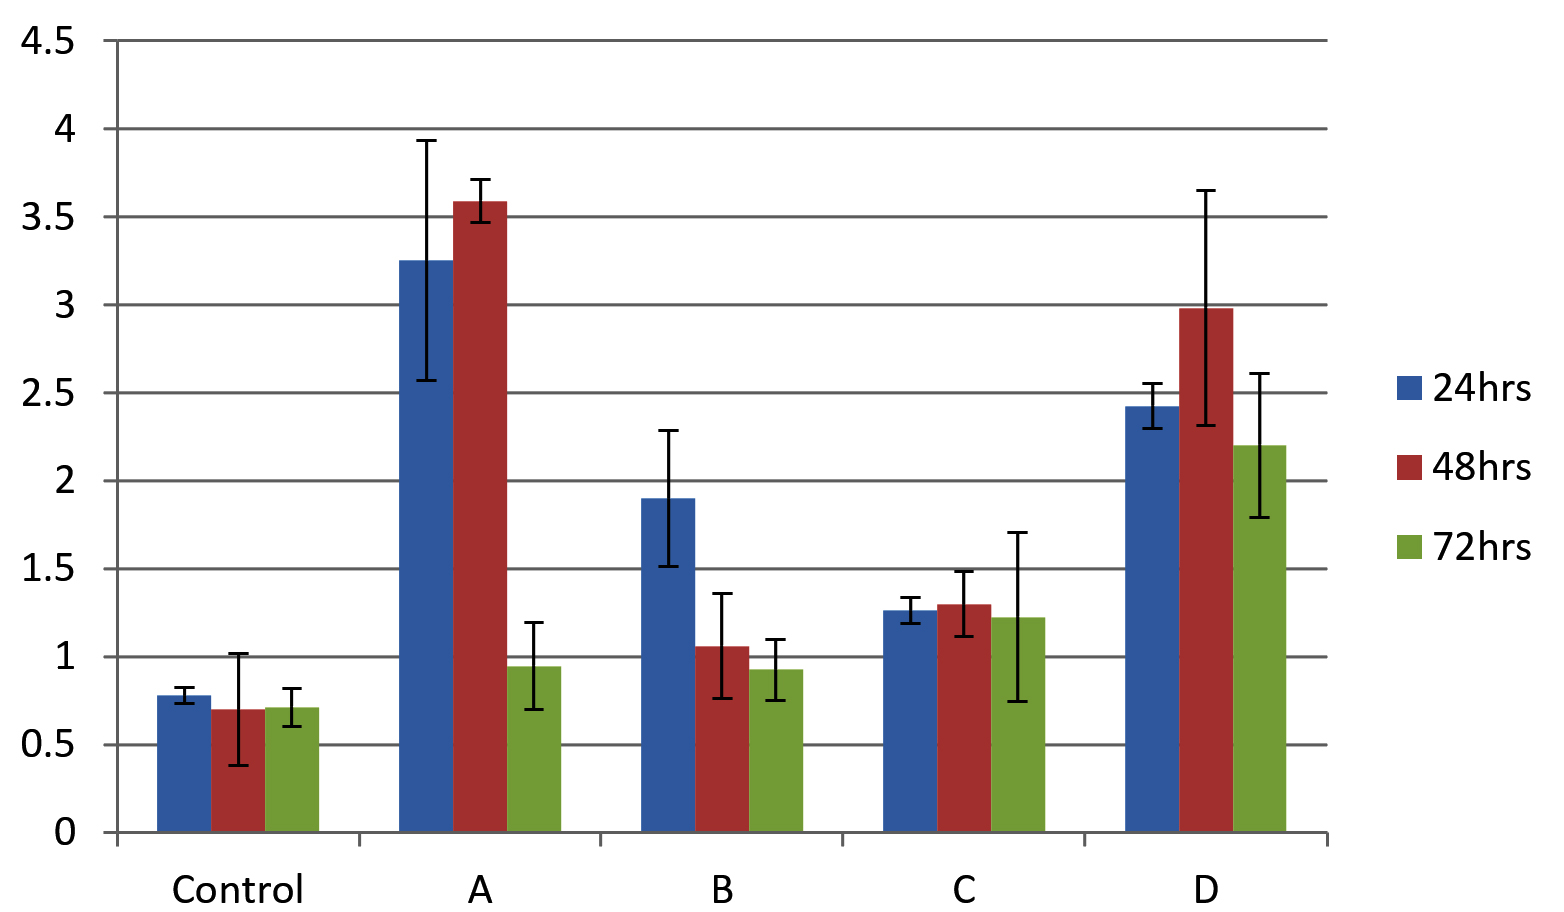
Figure 5. Graphical comparison of biofilm formation ability at 24, 48 and 72 h. X-axis shows bacterial isolates (A) S. aureus (B) S. hemolyticus (C) P. aeruginosa and (D) K. pneumoniae and Y-axis shows optical density at 570 nm. Error bar indicates Standard deviation
Screening for biofilm formation genes by PCR
PCR was performed for the presence of bioifilm formation genes in bacterial isolates. Figure 6 showing presence of all three studied genes i.e. icaA, icaA2 and clfA in all isolates.
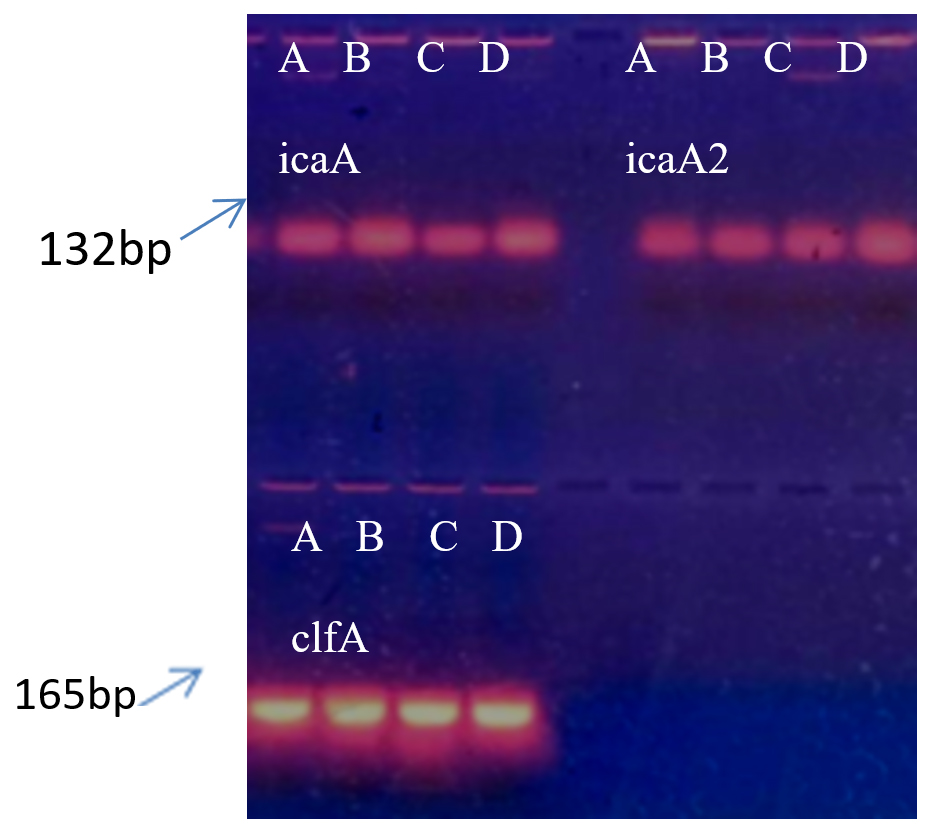
Figure 6. Agarose gel electrophoresis of PCR products. Wells 1 to 4 with icaA gene, wells 5 to 8 with icaA2 gene, lower wells 1 to 4 with clfA gene for (A) S. aureus, (B) S. hemolyticus, (C) P. aeruginosa and (D) K. pneumoniae respectively
The comparison of biofilm formation ability of four clinical isolates was performed and tabulated in Table 3. S. aureus and K. pneumoniae observed to be strong biofilm producers by almost all four test methods. S. hemolyticus found to be weak to moderate biofilm producer while P. aeruginosa found to be moderate to intermediate biofilm producer.
Table (3):
Comparison of biofilm formation ability of four isolates by four different methods
Biofilm formation assay |
Staphylococcus aureus |
Staphylococcus haemolyticus |
Pseudomonas aeruginosa |
Klebsiella pneumoniae |
|---|---|---|---|---|
CRA method |
Strong |
Weak |
Intermediate |
Moderate |
Crystal violet staining method |
Strong |
Weak |
Moderate |
Strong |
Microtiter plate method |
Moderate |
Moderate |
Weak |
Strong |
PCR for three genes |
+ |
+ |
+ |
+ |
Detection of EPS (Extracellular Polymeric Substances)
Analysis of Exopolysaccharide production
All the four isolates shows appearance of transparent zone around the cell following Indian ink stain indicating the presence of capsule indicating the presence of exopolysaccharide layer (Figure 7).
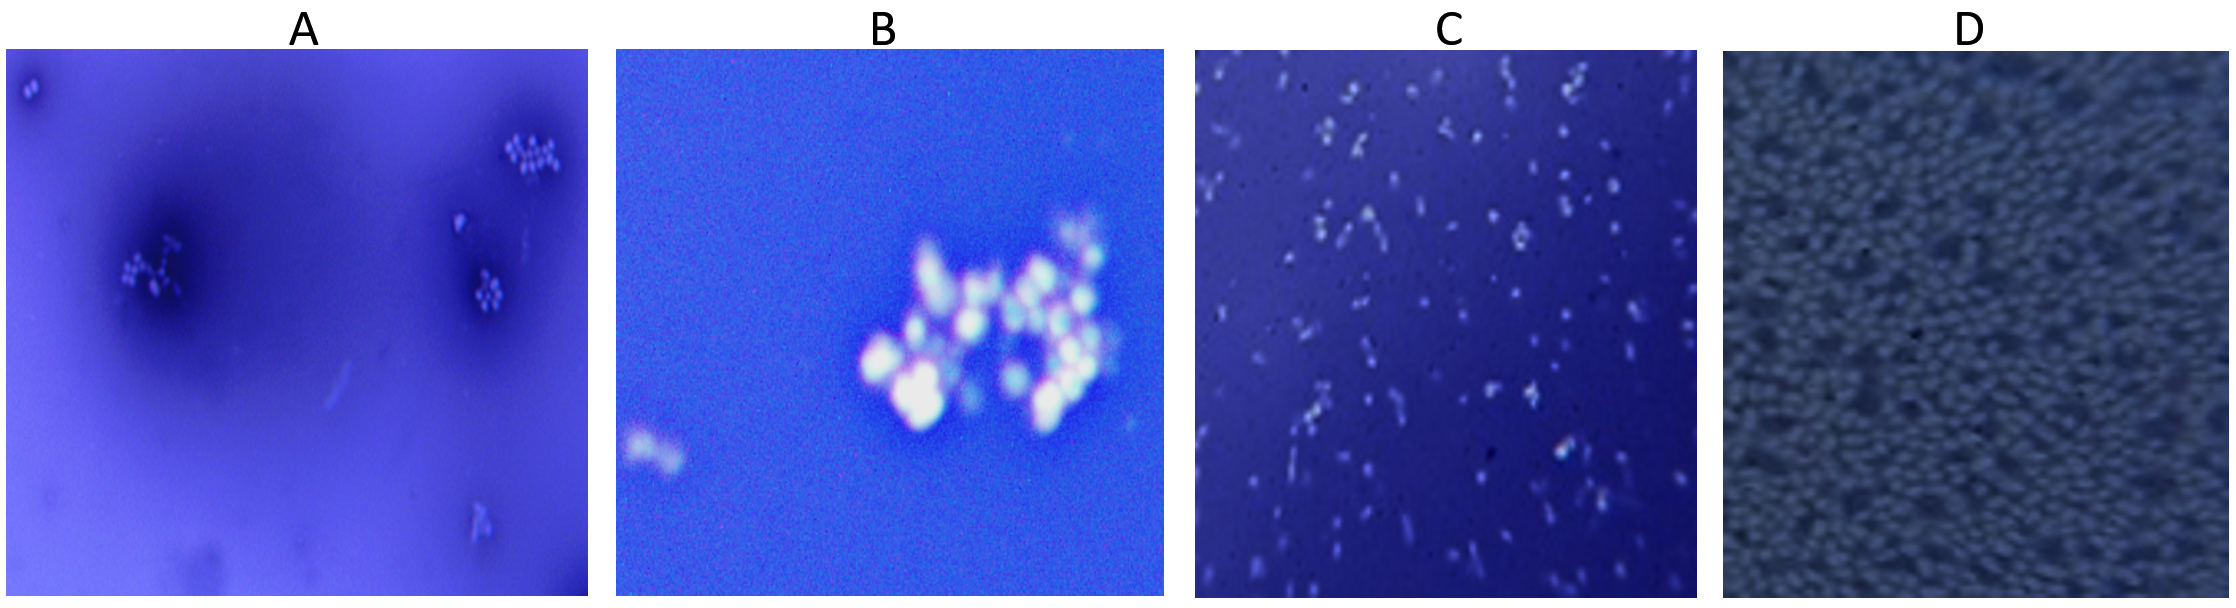
Figure 7. Visualization of Exopolysaccharide as a white layer around the cell by Indian ink staining in all 4 isolates (A) S. aureus, (B) S. hemolyticus, (C) P. aeruginosa and (D) K. pneumoniae
Quantification of carbohydrate and protein
Total carbohydrate content of EPS shows one common pattern for all isolates. Carbohydrate concentration was higher at 72 h biofilm growth for all isolates. Also among the four isolates K. pneumoniae shows higher amount of carbohydrate followed by P. aeroginosa. Both the species of Staphylococcus almost shows same amount at different time intervals (Figure 8).
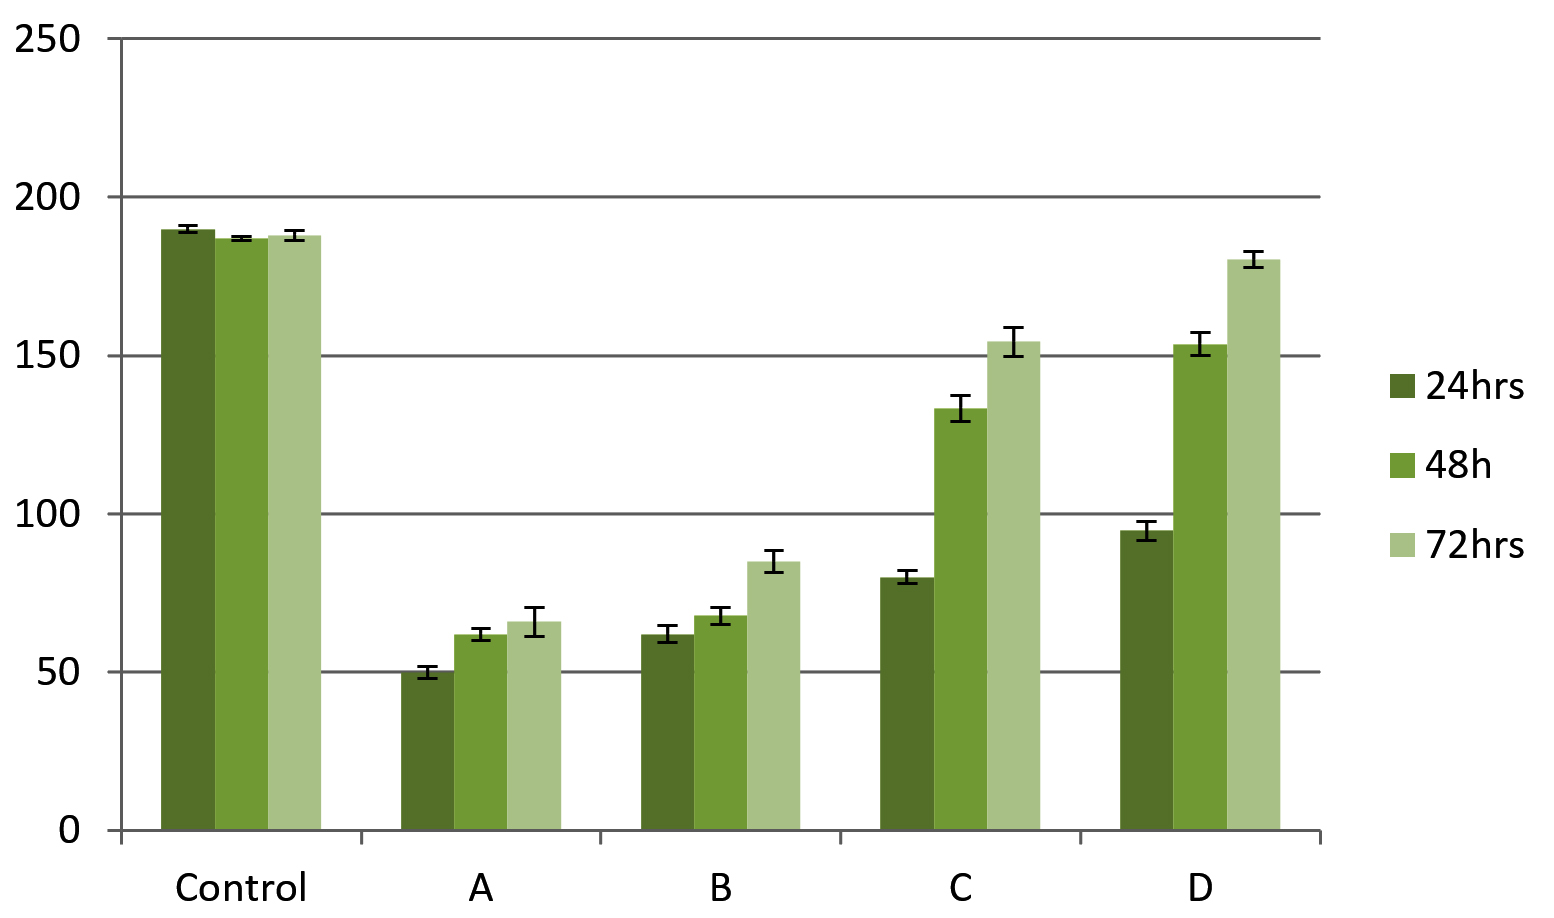
Figure 8. Carbohydrate estimation in EPS matrix by phenol-sulfuric acid method. X-axis shows microbial isolates (A) S. aureus, (B) S. hemolyticus, (C) P. aeruginosa and (D) K. pneumoniae while Y-axis shows carbohydrate concentration in mg/ml. Error bar indicates Standard deviation
The protein content of EPS of all isolates shows variation at different time intervals. Commonly 48 h growth of all isolates shows maximum protein content. Then protein amount was decreased after 72 h incubation. Among all isolates P. aeroginosa was showing high amount of protein production followed by S. aureus, S. hemolyticus and K. pneumoniae (Figure 9).
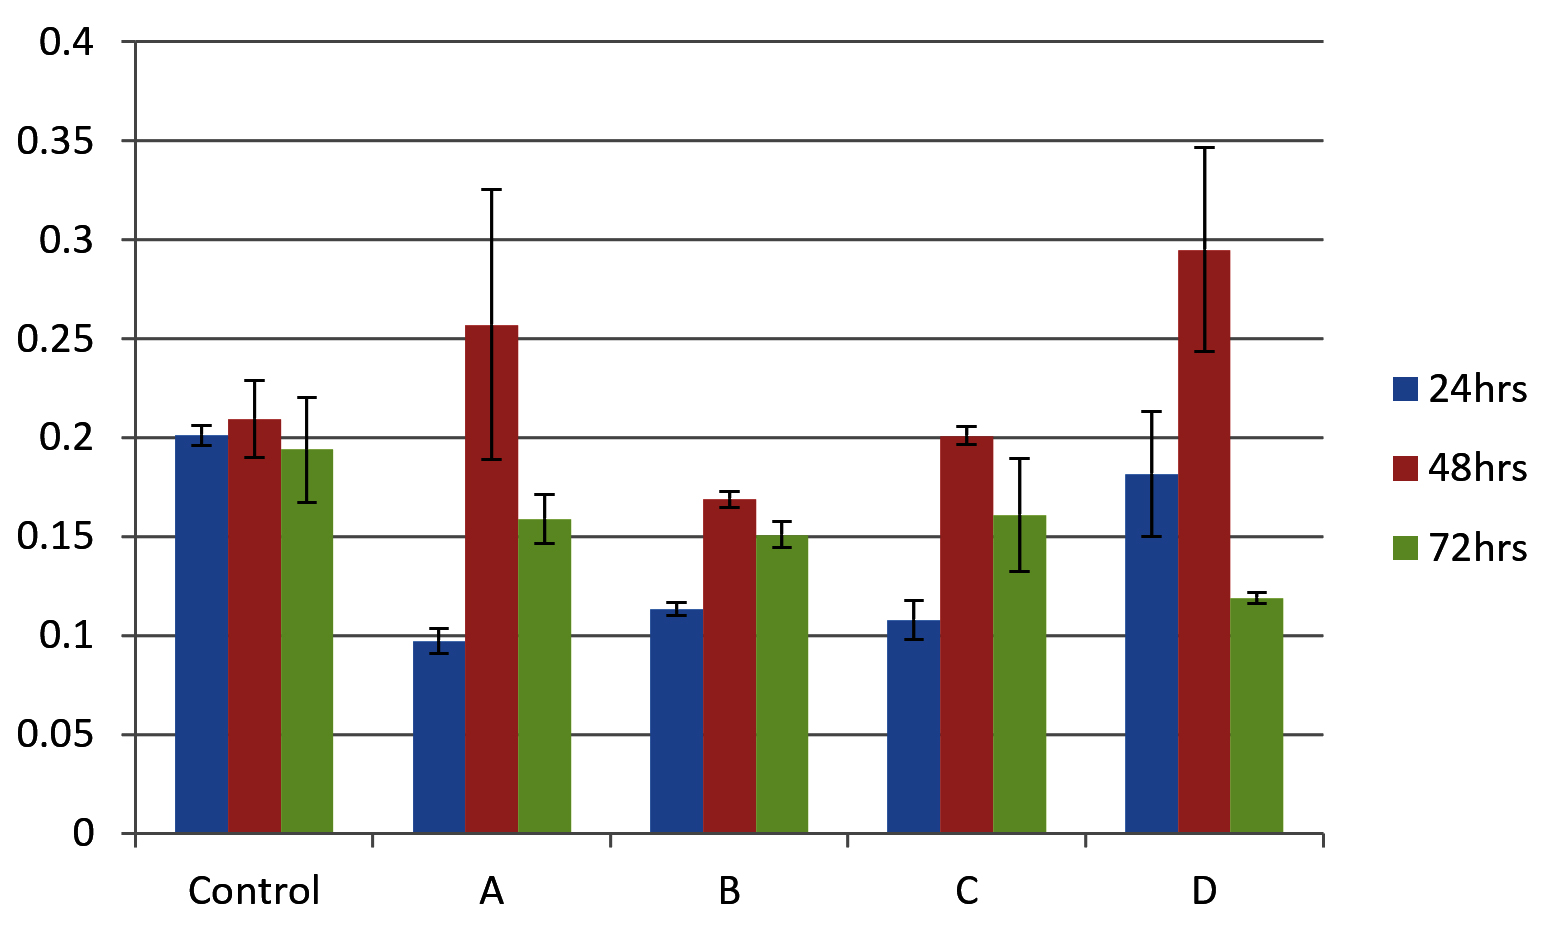
Figure 9. Estimation of protein in EPS matrix by Lowry method. X-axis shows control along with different bacterial isolates (A) S. aureus, (B) S. hemolyticus, (C) P. aeruginosa and (D) K. pneumoniae while Y-axis shows protein concentration in mg/ml. Error bar indicates Standard deviation
Detection of eDNA
As shown in Figure 10, eDNA was detected in all isolates. The band intensities varied among the isolates. eDNA was detected at 72 h incubation in all isolates. After 24 h and 48 h incubation time, S. hemolyticus and P. aeroginosa were not showing any band might be due to degradation by some extracellular nucleases.
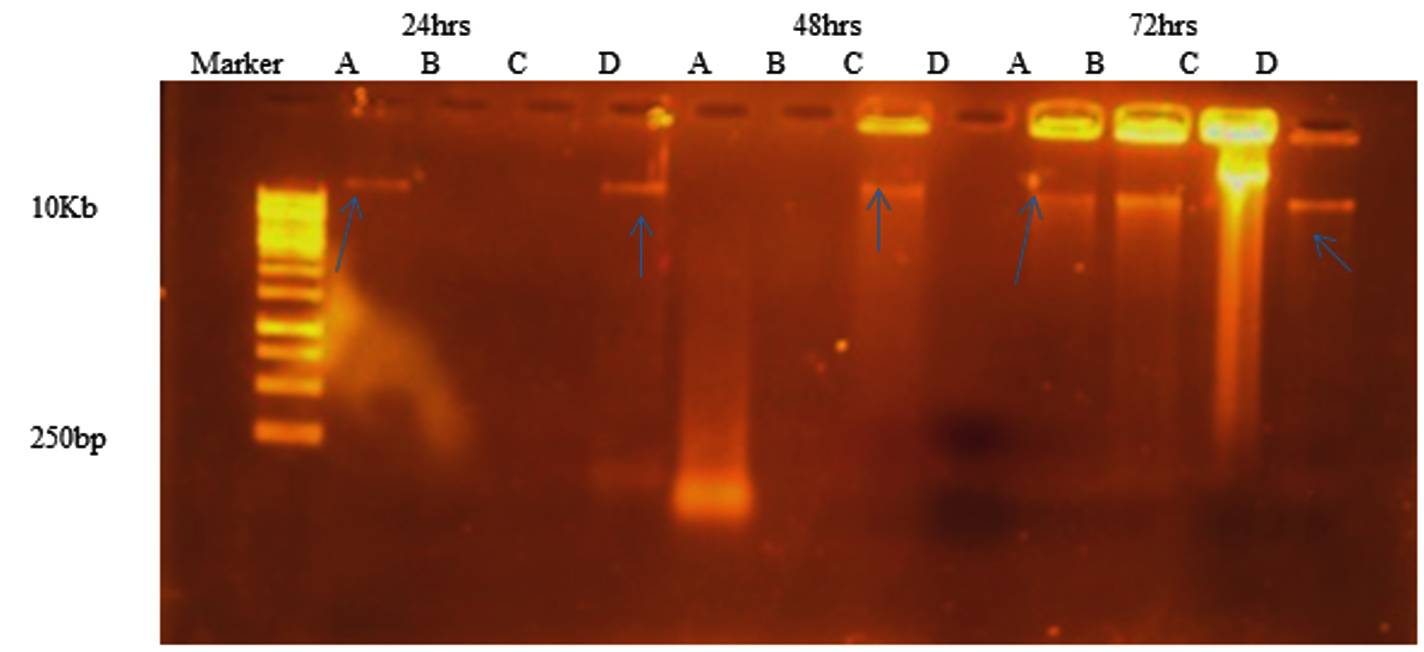
Figure 10. Agarose gel electrophoresis indicating the presence of e DNA after 24 hrs (well 2-4), 48 hrs (well 5-8) and 72 hrs (well 9-12) of growth for microbial isolates (A) S. aureus, (B) S. hemolyticus, (C) P. aeruginosa and (D) K. pneumoniae
The comparison of EPS contents was done and tabulated in Table 4. Carbohydrate content was increases with incubation time whereas protein content was declined after 48 h. Presence of eDNA shows variation within bacteria isolates.
Table (4):
Comparison of Carbohydrate, protein and eDNA contents of all isolates at different time intervals. (+) shows presence and low amount, (++) shows moderate amount, (+++) shows higher amount, (-) shows absence of result
| Isolates | Staphylococcus aureus | Staphylococcus haemolyticus | Pseudomonas aeruginosa | Klebsiella pneumoniae | ||||||||
|---|---|---|---|---|---|---|---|---|---|---|---|---|
| Time interval | 24 h | 48 h | 72 h | 24 h | 48 h | 72 h | 24 h | 48 h | 72 h | 24 h | 48 h | 72 h |
| Carbohydrate estimation | + | ++ | +++ | + | ++ | +++ | + | ++ | +++ | + | ++ | +++ |
| Protein estimation | + | +++ | ++ | + | +++ | ++ | ++ | +++ | + | ++ | +++ | + |
| eDNA estimation | + | – | + | – | – | + | – | – | + | + | + | + |
Chronic wounds become major challenge to the health care system. Bacterial biofilm is the major reason behind the chronicity of wound. Chronic wound may contains Gram-positive and Gram-negative bacteria.10 Studies have explored the strategies or mechanisms used by bacteria to form biofilm. They also discovered that these bacteria produces matrix called Extracellular Polymeric Substances (EPS) which protect them for host immunity and drug administered.11 These characteristics make biofilms as an intensively developing research area. The composition of EPS, i.e. protein, carbohydrates and eDNA with content with may vary with time and surrounding conditions.15
In present work, S. aureus, S. haemolyticus, P. aeruginosa and K. pneumoniae isolated from wound sample were investigated for their biofilm forming ability. Isolates were categorized into strong, moderate or weak biofilm producer. Comparative study was performed for the analysis of biofilm formation abilities of bacterial isolates (Table 2). CRA method showed that S. aureus was strong slime producer with black, dry colony. The interpretation of CRA method suggested that the presence of shiny or rough black colonies was considered to be positive for biofilm formation.24,21 Tube method indicated strong biofilm formation with S. aureus and K. pneumoniae for 24 h incubation with varying color intensities. This result in accordance with the data reported by Darwish et al.24 K. pneumoniae indicted strong biofilm formation ability with microtiter plate assay. This result are in line with the reports of Prasantha et al.26 Comparison of different methods of biofilm assay used in previous studies is shown in Table 5. Our results are well correlated with these previous studies.
Table (5):
Comparison of different methods of biofilm detection used in previous studies
| SN | Assessment Methods of biofilm formation | Comparative studies | ||||||||
|---|---|---|---|---|---|---|---|---|---|---|
| CRA method | CV method | MTP method | ||||||||
| Strong | moderate | weak | Strong | moderate | weak | Strong | moderate | weak | ||
| 1 | 1 | 2 | 1 | 2 | 1 | 1 | 1 | 2 | 1 | Present study |
| 2 | 4 | – | – | 23 | 40 | 52 | – | – | – | Yasmeen et al.20 |
| 3 | 13 | 14 | 13 | – | – | – | 21 | 11 | 8 | Samah et al.24 |
| 4 | 51 | – | – | 13 | 21 | 33 | 64 | 8 | 11 | Harika et al.21 |
The results of biofilm formation mentioned above were confirmed for the presence of biofilm formation genes in bacterial strains. Three biofilm associated genes were detected using simplex PCR method. Agarose gel electrophoresis of PCR product indicated the occurrence of icaA, icaA2 and clfA gene in all four bacterial isolates. The reported study showed that the icaA genes are necessary for intracellular adhesion. Moreover these genes are associated with slime production and clumping responsible for attachment or adhesion as one of the major step for biofilm production.12 In our study, S. aureus and K. pneumoniae showed strong biofilm producers whereas P. aeruginosa showed moderate biofilm producer followed by S. haemolyticus.
Indian ink staining indicated the presence of Exopolysaccharide layer around the bacterial surface. Darwish et al. study has showed a halo zone around 108 isolates indicating Exopolysaccharide layer surrounded by cells.24 Studies with biochemical methods showed various amount of EPS contents. Carbohydrate content of EPS showed increment with incubation time in all bacteria while protein content showed variation within the bacteria.15,34 A similar pattern of carbohydrate and protein accumulation was observed across all bacterial isolates. Statistical analysis indicated that the effect of time was statistically significant (p < 0.05). Previous studies by Dominique et al.35 and Kuschmierz et al.15 have reported variations in extracellular polymeric substance (EPS) composition in response to changes in growth conditions and media composition. Additionally, extracellular DNA (eDNA) was detected in all bacterial isolates after 72 hours of incubation.
This study outlined four distinct biofilm assay methods and primarily focused on the detection of key EPS components, including carbohydrates, proteins, and eDNA. Further investigation is required to analyze biofilm structure using microscopy while assessing variations in carbon sources and growth conditions.
Polymicrobial biofilms pose a significant challenge to the treatment of wound infections, making their early detection crucial. The findings of this study indicate that bacteria isolated from wound samples exhibited varying degrees of biofilm formation, as assessed by different detection methods, with a diverse composition of macromolecules in their extracellular polymeric substances (EPS). These results highlight the dynamic changes in EPS composition during the transition from the planktonic to biofilm stage. Early biofilm detection can serve as a valuable tool in guiding treatment strategies. Further research and experimentation are necessary to elucidate the biofilm formation process and investigate the specific molecular interactions within the biofilm matrix that contribute to its structural stability under different environmental conditions.
ACKNOWLEDGMENTS
The authors gratefully acknowledge the grant from DBT BUILDER (102/IFD/SAN/1337/2021-2022) to the institute. Authors also acknowledge the facilities provided by Bharati Vidyapeeth, Pune, for this project.
CONFLICT OF INTEREST
The authors declare that there is no conflict of interest.
AUTHORS’ CONTRIBUTION
All authors listed have made a substantial, direct and intellectual contribution to the work, and approved it for publication.
FUNDING
None.
DATA AVAILABILITY
All datasets generated or analyzed during this study are included in the manuscript.
ETHICS STATEMENT
Not applicable.
- Singh S, Young A. Clare-Ellen McNaught, The physiology of wound healing, Surgery (Oxford). 2017;35(9):473-477.
Crossref - Falanga V, Isseroff RR, Soulika AM, et al. Chronic wounds. Nat Rev Dis Primers. 2022;8(1):50.
Crossref - Sen CK. Human Wound and Its Burden: Updated 2020 Compendium of Estimates. Adv Wound Care (New Rochelle). 2021;10(5):281-292.
Crossref - Wilkinson HN, Hardman MJ. Wound healing: cellular mechanisms and pathological outcomes. Open Biol. 2020;10(9):200223.
Crossref - Liu Y, Long S, Wang H, Wang Y. Biofilm therapy for chronic wounds. Int Wound J. 2024;21(2):e14667.
Crossref - Clinton A, Carter T. Chronic Wound Biofilms: Pathogenesis and Potential Therapies. Lab Med Lab Med FFalalll. 2015;46(4):277-284.
Crossref - Rahim K, Saleha S, Zhu X, Huo L, Basit A, Franco OL. Bacterial Contribution in Chronicity of Wounds. Microb Ecol. 2017;73(3):710-721.
Crossref - Gupta P, Sarkar S, Das B, Bhattacharjee S, Tribedi P. Biofilm, pathogenesis and prevention-a journey to break the wall: a review. Arch Microbiol. 2016;198(1):1-15.
Crossref - Cassin EK, Araujo-Hernandez SA, Baughn DS, et al. OprF Impacts Pseudomonas aeruginosa Biofilm Matrix eDNA Levels in a Nutrient-Dependent Manner. J Bacteriol. 2023;205(7):e0008023.
Crossref - Vestby LK, Grønseth T, Simm R, Nesse LL. Bacterial biofilm and its role in the pathogenesis of disease. Antibiotics. 2020;9(2):9020059.
Crossref - Di Martino P. Extracellular polymeric substances, a key element in understanding biofilm phenotype. AIMS Microbiol. 2018;4(2):274-288.
Crossref - Omidi M, Firoozeh F, Saffari M, Sedaghat H, Zibaei M, Khaledi A. Ability of biofilm production and molecular analysis of spa and ica genes among clinical isolates of methicillin-resistant Staphylococcus aureus. BMC Res Notes. 2020;13(1):19.
Crossref - Karygianni L, Ren Z, Koo H, Thurnheer T. Biofilm Matrixome: Extracellular Components in Structured Microbial Communities. Trends Microbiol. 2020;28(8):668-681.
Crossref - Campoccia D, Montanaro L, Arciola CR. Extracellular DNA (eDNA). A Major Ubiquitous Element of the Bacterial Biofilm Architecture. Int J Mol Sci. 2021;22(16):9100.
Crossref - Kuschmierz L, Meyer M, Brasen C, Wingender J, Schmitz OJ, Siebers B. Exopolysaccharide composition and size in Sulfolobus acidocaldarius biofilms. Front Microbiol. 2022;13:982745.
Crossref - Ruhal R, Kataria R. Biofilm patterns in gram-positive and gram-negative bacteria. Microbiol Res. 2021;251:126829.
Crossref - Tang T, Xu Y, Wang J, et al. Evaluation of the differences between biofilm and planktonic Brucella abortus via metabolomics and proteomics. Funct Integr Genomics. 2021;(3-4):421-433.
Crossref - Pandit S, Fazilati M, Gaska K, et al. The Exo-Polysaccharide Component of Extracellular Matrix is Essential for the Viscoelastic Properties of Bacillus subtilis Biofilms. Int J Mol Sci. 2020;21(18):6755.
Crossref - Melol PC, Ferreira LM, Filho AN, Zafalon LF, Vicente HIG, de Souza V. Comparison of methods for the detection of biofilm formation by Staphylococcus aureus isolated from bovine subclinical mastitis. Braz J Microbiol. 2013;44(1):119-124.
Crossref - Leshem T, Schnall BS, Azrad M, Baum M, Rokney A, Peretz A. Incidence of biofilm formation among MRSA and MSSA clinical isolates from hospitalized patients in Israel. J Appl Microbiol. 2022;133(2):922-929.
Crossref - Harika K, Shenoy V, Narasimhaswamy N, Chawla K. Detection of biofilm production and its impact on antibiotic resistance profile of bacterial isolates from chronic wound infections. J Glob Infect Dis. 2020;12(3):129-134.
Crossref - Yang C-H, Su P-W, Moi S-H, Chuang L-Y. Biofilm Formation in Acinetobacter Baumannii: Genotype-Phenotype Correlation. Molecules. 2019; 24(10):1849.
Crossref - Shahmoradi M, Faridifar P, Shapouri R. Determining the Biofilm Forming Gene Profile of Staphylococcus aureus Clinical Isolates via Multiplex Colony PCR Method. Rep biochem mole biol. 2019;7(2):181-188.
- Darwish SF, Asfour HAE. Investigation of Biofilm Forming Ability in Staphylococci Causing Bovine Mastitis Using Phenotypic and Genotypic Assays. The Scientific World Journal 2013;2013:378492.
Crossref - Yamagishi J, Sato Y, Shinozaki N, et al. Comparison of Boiling and Robotics Automation Method in DNA Extraction for Metagenomic Sequencing of Human Oral Microbes. PLoS One. 2016;11(4):e0154389. 2016.
Crossref - Prasanth P, Saravanakumari P. Detection of Intercellular Adhesion Genes (Ica) in Staphylococcus aureus Causing Implant Associated Infections. Int J Pharm Pharm Sci. 2017;9(10):76-80.
Crossref - Atshan SS, Shamsudin MN, Karunanidhi A, et al. Quantitative PCR analysis of genes expressed during biofilm development of methicillin resistant Staphylococcus aureus (MRSA). Infect Genet Evol. 2013;18:106-112.
Crossref - Nourbakhsh F, Namvar AE. Detection of genes involved in biofilm formation in Staphylococcus aureus isolates. GMS Hyg Infect Control. 2016;11.
Crossref - Chen W, Liang J, He Z, Jiang W. Preliminary study on total protein extraction methods from Enterococcus faecalis biofilm. Genet Mol Res. 2016;15(3):1-9.
Crossref - Zavrel T, Ocenasova P, Sinetova MA, Cerveny J. Determination of Storage (Starch/Glycogen) and Total Saccharides Content in Algae and Cyanobacteria by a Phenol-Sulfuric Acid Method. Bio Protoc. 2018;5;8(15):e2966.
Crossref - Loptien J, Vesting S, Dobler S, Mohammadi S. Evaluating the efficacy of protein quantification methods on membrane proteins. Open Biol. 2024;14(12):240082.
Crossref - Buntenbroich I, Simoes T, Escobar-Henriques M. Analysis of Protein Stability by Synthesis Shutoff. Bio Protoc. 2021;11(22):e4225.
Crossref - Sugimoto S, Sato F, Miyakawa R, et al. Broad impact of extracellular DNA on biofilm formation by clinically isolated Methicillin-resistant and -sensitive strains of Staphylococcus aureus. Sci Rep. 2018;8:2254.
Crossref - Khusro A, Sankari D. Synthesis and estimation of total extracellular protein content in Bacillus subtilis under mild stress condition of certain antimicrobials. Asian J Pharm Clin Res. 2015;8(1):86-90.
- Limoli DH, Jones CJ, Wozniak DJ. Bacterial Extracellular Polysaccharides in Biofilm Formation and Function. Microbial Biofilms. 2015;(3).
Crossref
© The Author(s) 2025. Open Access. This article is distributed under the terms of the Creative Commons Attribution 4.0 International License which permits unrestricted use, sharing, distribution, and reproduction in any medium, provided you give appropriate credit to the original author(s) and the source, provide a link to the Creative Commons license, and indicate if changes were made.