


Sheetal Gouda ![]() , G. Naveen
, G. Naveen![]() and F. Sneha Kukanur
and F. Sneha Kukanur![]()
COVID-19 classified under emerging infectious diseases has spread across the world resulting in many casualties. India reported its first case on 30th January 2020 and has completed 100 days in this pandemic period. The government of India has issued stringent guidelines and imposed a lockdown for long periods to ensure the practising of social distancing. This paper reviews and discusses the current trends in the confirmed cases of India in comparison with the other prominent countries around the globe. A novel approach using a sigmoid function to predict and forecast the trends for cases in India are also presented in this work. By placing the current time on the sigmoid curve, forecasting the total number of confirmed cases by the end of the pandemic is made. If proper measures and stringent guidelines are not followed, India may have to endure a total confirmed case of up to 4.4 lakh. The prediction also suggests that 99.9% of the pandemic may end in India by 27th July 2020. The best possible approach is to undertake preventive measures by strictly adhering to the guidelines and policies set by the government. Performing hand hygiene, practicing social distancing, surveillance and isolation is the only means to break the chain of transmission and control the pandemic.
COVID-19, India, coronavirus, forecasting, sigmoid
Infectious diseases, which have appeared for the first time in a population or whose incidence have increased in the past two decades, are defined as Emerging Infectious Diseases (EID). Evolution or development of resistance in the pathogens, demographic and behavioural changes in the host, changing ecosystem, urbanisation, international travel and development of technology are some of the factors that contribute to the EID. Around 73% of these infections are noted to be of animal origin1. Over the past twenty years, viruses like severe acute respiratory syndrome (SARS) in 2003, H1N1 influenza in 2009 and Middle East respiratory syndrome coronavirus (MERSCoV) in 2012 had emerged resulting in pandemics. At present a novel severe acute respiratory syndrome coronavirus-2 (SARS-CoV-2), also known as Coronavirus Disease 2019 (COVID-19) emerged in 2019 and World Health Organisation (WHO) declared it as a pandemic in March 2020. Corona-viruses are spherical, enveloped single-stranded RNA viruses, around 100 nm, belonging to the family Coronaviridae. Corona-viruses have club-shaped peplomer on their surface resembling the solar corona thus deriving their name. The first case of COVID-19 was reported from Wuhan, China and it was notified to WHO on 31st December 20192. The initial cases had a common exposure to the seafood market in Wuhan, predicting the origin of this novel virus from animals3. COVID-19 is known to be highly infective, rapidly spreading among individuals mainly by aerosol droplets, physical contact or airborne route4. COVID-19 is also known to shed in faeces suggesting faeco-oral transmission5–7. Symptoms for this disease can take 2-14 days to appear and can range from fever, rhinorrhoea, sneezing, sore throat, cough, shortness of breath to pneumonia-like illness and even cardiac arrhythmia.
Many researchers and data scientists have carried out extensive research and analysis for predicting the possible end of the pandemic in countries around the world. Forecasting is a method used to analyse and predict the future trends8,9. Prediction models (compartmental) like Susceptible, Infectious, Recovered/Resistant (SIR) models10–12 have been used to forecast the number of cases and hence predict the date on which decline of 97 to 99% of the cases occurs. Another variant of the model called Susceptible, Exposed, Infectious, Recovered/Resistant (SEIR) model is used to have additional complexity to the existing model by accommodating the rate of exposure of the disease13. But reports have come up stating that the complex SEIR model may not be accurate as compared to SIR model14. This is because of the increased complexity and specific computations carried out while the dynamics of the disease tends to happen in a more generic manner. Apart from these models, a time series based statistical model by assuming Gaussian normal distribution15 and agent-based models16 are also developed in understanding the future trends of the cases. Unfortunately, most of the models are unable to predict the ongoing development of new cases due to the highly complex nature of the spread of the disease.
A simple means of easily predicting the severity of the increasing cases does not seem to have been addressed in literature. For any country, the behavioural pattern of the total number of cases follows an S curve (sigmoid function) which is extensively dealt with in this work. An easier means of forecasting the future trends by considering hypothetical cases is carried out. Also, relative progress and trends of cases reported in India is made in comparison with other countries around the world.
Epidemiology
As on May 7 2020, more than 3.5 million cases of COVID-19 and 250,000 deaths have now been reported to WHO17. The pandemic of COVID-19 originated from China, rapidly spreading across many countries and territories which has extended over 180 countries in the world. The most badly affected countries are the United States of America (USA), Italy, Spain, United Kingdom (UK), etc. Although the virus was initially reported in China in December 2019, the country has reported having controlled the spread of the disease. According to global media and experts, countries like South Korea, Hong Kong, Japan etc. have been able to manage the pandemic in the most effective manner18.
In India, 52,952 confirmed cases are reported with total deaths of 1783 as on day 100 (7th of May, 2020)19. The first case in India was reported from Kerala state on 30th January 202020. States showing severe outbreaks (>3,000 cases) include Maharashtra, Gujarat, Tamil Nadu, Delhi, Rajasthan, Madhya Pradesh, Uttar Pradesh. As per the National Health Profile 2018, there were 710,761 beds in public healthcare facilities21, clearly stating that country cannot handle even if 1% of the population are affected by COVID-19. Under such conditions, the government of India has been stringent in imposing the practice of social distancing, which prevents the spread of infection. On 22 March 2020, 14-hour public curfew and nationwide lockdown of 21days from 24 March was implemented to restrict social interactions to arrest the spread of infection. The government later took additional stringent actions early on by further extending the lockdown from 15th April to 3rd May and additional extension up to 17th May, 2020.
The COVID-19 pandemic has severely affected the economy, life-style, and health of people, which turned out to be a major concern for every citizen. Further, the common questions like how long will this scenario continue and when the infection will be controlled is rather highly unpredictable.
Trends of India’s COVID-19 cases relative to the World
China was indicated to be the worst affected by COVID-19 at the beginning of this year, however, the daily reported cases have declined to single digits in May, 2020. The first case reported in India was on 30th January, 2020 in the state of Kerala. The timeline of cases reported in the number of days for India and other countries is shown in Table 1. Barring China, most of the other countries in Table 1 have reported their first case within 12 days. In the next 100 days, the United States of America (USA), Spain, Italy, the United Kingdom (UK) have exponentially increased their cases. It is evident that for the first 50,000 cases, the best control of the disease is handled by Japan, South Korea, and Australia followed by India.
Table (1):
Timeline (in number of days) reported for the cumulative total of confirmed cases of different countries.
| Sl. No. | Country | First case reported on | Days took to reach the confirmed cases | Cases as on 7th May 2020 | ||||
|---|---|---|---|---|---|---|---|---|
| 10 | 100 | 1,000 | 10,000 | 50,000 | ||||
| 1 | USA | 21-01-2020 | 14 | 43 | 51 | 60 | 65 | 12,28,603 |
| 2 | Spain | 01-02-2020 | 27 | 32 | 39 | 47 | 56 | 2,21,447 |
| 3 | Italy | 31-01-2020 | 23 | 25 | 31 | 41 | 52 | 2,14,457 |
| 4 | UK | 31-01-2020 | 25 | 36 | 45 | 57 | 68 | 2,01,201 |
| 5 | Germany | 28-01-2020 | 8 | 34 | 43 | 53 | 62 | 1,66,091 |
| 6 | Russia | 01-02-2020 | 36 | 47 | 57 | 70 | 82 | 1,65,929 |
| 7 | France | 25-01-2020 | 15 | 37 | 45 | 56 | 68 | 1,37,150 |
| 8 | Turkey | 12-03-2020 | NA* | 8 | 12 | 20 | 32 | 1,31,744 |
| 9 | Brazil | 26-02-2020 | 11 | 19 | 26 | 40 | 60 | 1,25,218 |
| 10 | Iran | 20-02-2020 | 3 | 8 | 13 | 23 | 44 | 1,01,650 |
| 11 | China | 31-12-2019 | NA* | 20 | 26 | 33 | 45 | 83,970 |
| 12 | Canada | 26-01-2020 | 31 | 47 | 57 | 69 | 95 | 63,496 |
| 13 | India | 30-01-2020 | 36 | 47 | 61 | 77 | 100 | 52,592 |
| 14 | Singapore | 24-01-2020 | 7 | 38 | 70 | 91 | – | 20,198 |
| 15 | Japan | 15-01-2020 | 16 | 39 | 67 | 96 | – | 15,463 |
| 16 | South Korea | 20-01-2020 | 13 | 33 | 38 | 75 | – | 10,810 |
| 17 | Australia | 25-01-2020 | 9 | 46 | 58 | – | – | 6,875 |
| World | 31-12-2019 | NA* | 20 | 26 | 33 | 45 | 37,15,414 | |
*NA- Not available
Sigmoid curve
The total number of confirmed cases are initially very few. With time, the number of cases accelerates by increasing exponentially. In the last period of the pandemic, the number of cases drops and finally reduces to zero. A plot of the total number of confirmed cases against time has a shape of an ‘S’ curve which can be approximated by the sigmoid function given in equation 1.
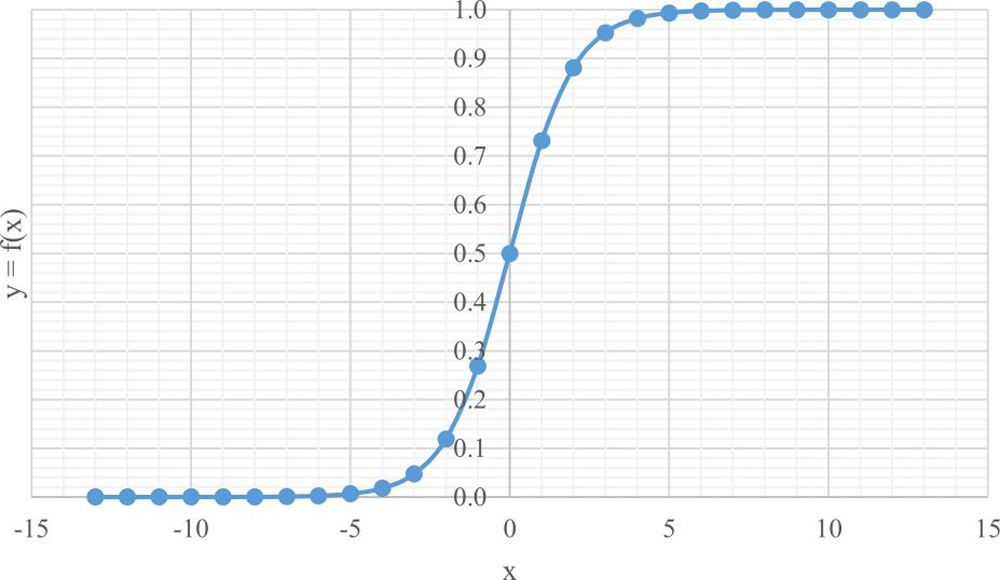
Fig. 1. A generic plot of sigmoid curve
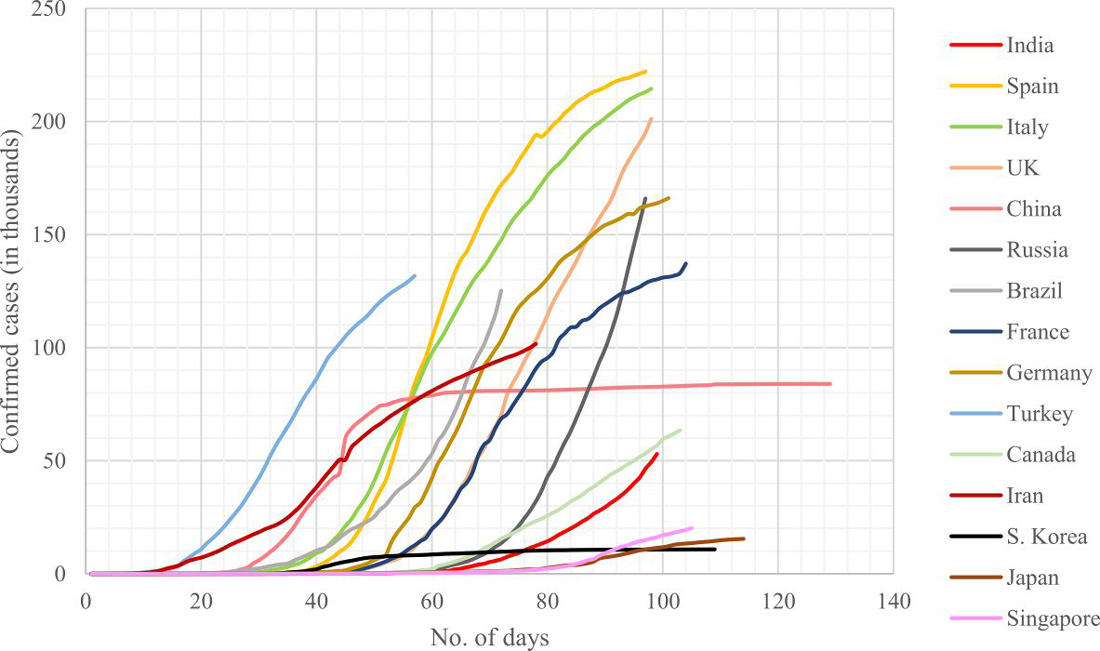
Fig. 2. Plots of confirmed cases against number of days since first reported case for different countries
Y = ex/ex+1 …(1)
Where, y is the dependant variable that varies from 0 to 1 and x is the independent variable varying between-∞ to + ∞. A generic plot of the sigmoid curve is shown in Fig. 1. The center most point on the curve corresponds to exactly half the value of y. The analogy for the current COVID-19 pandemic to be understood is that the variable y corresponds to the total number of confirmed cases in a country and x corresponds to the time since the first reported case. Fig. 2 shows a plot of the cases against time for different countries. The plots of all the countries comply with the sigmoid curve as discussed before. In the Fig., only China and South Korea have managed to reach the latter part of the curve. South Korea has tremendously flattened the curve at a very early stage since its first reported case. The UK has still not been able to achieve the decreasing trend in the number of cases while their other European counterparts show a bend in their S curve depicting the lowering of cases and reaching its saturation limit. Other countries indicating bend in their curves are Singapore, Japan, Iran, and Turkey. The USA (not shown in the Fig.) also have not been able to flatten the curve. India had a lower rate of increase in the cases in the early stages. An increasing trend is observed in the number of cases beyond day 65 (first week of April). India’s performance curve should reflect similar to South Korea’s curve, lest there could be drastic increase in the cases which may not be handled by the available healthcare facilities. In the next section, we further discuss the pattern of the S curve for India that can result in a varying effect on the number of cases in the latter stages of the pandemic.
Forecasting India’s COVID-19 cases using the S curve
From Fig. 1 and 2, it is shown that the confirmed cases behave like a sigmoid curve and that India’s curve does not show any signs of bending as on 7th of May, 2020. We further assume the following cases for India and analyze the situation and its effects:
Case (i) and (ii): India is still in the increasing trend of the S curve and assumes that day 100 could correspond to points x=-2 and x=-1 respectively in Fig. 1.
Case (iii): India is exactly at the center point of the S curve and there shall be a decreasing trend observed in the next few days. We assume that day 100 corresponds to x=0 in Fig. 1.
Case (iv): India has already passed the center point and will just begin to decrease its cases. Day 100 is corresponding to x=+1 in Fig. 1.
Data for all the four cases are calculated using equation 2 in Microsoft Excel and tabulated in Table 2.
Table (2):
Forecasted possibilities of confirmed cases in the future for India using S curve.
| Sigmoid function | Case (i) | Case (ii) | Case (iii) | Case (iv) | |||||
|---|---|---|---|---|---|---|---|---|---|
| x | y=f(x) | No. of days | Confirmed cases | No. of days | Confirmed cases | No. of days | Confirmed cases | No. of days | Confirmed cases |
| -13 | 2.26E-06 | 0 | 1 | ||||||
| -12 | 6.14E-06 | 9 | 3 | 0 | 1 | 1 | 0 | ||
| -11 | 1.67E-05 | 18 | 7 | 9 | 3 | 0 | 2 | 0 | 1 |
| -10 | 4.54E-05 | 27 | 20 | 18 | 9 | 9 | 5 | 8 | 3 |
| -9 | 1.23E-04 | 36 | 55 | 27 | 24 | 18 | 13 | 16 | 9 |
| -8 | 3.35E-04 | 45 | 149 | 36 | 66 | 27 | 36 | 25 | 24 |
| -7 | 9.11E-04 | 54 | 405 | 45 | 179 | 36 | 96 | 33 | 66 |
| -6 | 0.0025 | 63 | 1,098 | 54 | 487 | 45 | 262 | 41 | 179 |
| -5 | 0.0067 | 72 | 2,973 | 63 | 1,318 | 54 | 709 | 50 | 485 |
| -4 | 0.0180 | 81 | 7,990 | 72 | 3,541 | 63 | 1,905 | 58 | 1,303 |
| -3 | 0.0474 | 90 | 21,067 | 81 | 9,338 | 72 | 5,023 | 66 | 3,435 |
| -2 | 0.1192 | 100 | 52,952 | 90 | 23,470 | 81 | 12,624 | 75 | 8,634 |
| -1 | 0.2689 | 109 | 1,19,468 | 100 | 52,952 | 90 | 28,482 | 83 | 19,480 |
| 0 | 0.5000 | 118 | 2,22,109 | 109 | 98,445 | 100 | 52,952 | 91 | 36,216 |
| 1 | 0.7311 | 127 | 3,24,749 | 118 | 1,43,938 | 109 | 77,422 | 100 | 52,952 |
| 2 | 0.8808 | 136 | 3,91,265 | 127 | 1,73,421 | 118 | 93,280 | 108 | 63,798 |
| 3 | 0.9526 | 145 | 4,23,150 | 136 | 1,87,553 | 127 | 1,00,881 | 116 | 68,997 |
| 4 | 0.9820 | 154 | 4,36,228 | 145 | 1,93,349 | 136 | 1,03,999 | 125 | 71,129 |
| 5 | 0.9933 | 163 | 4,41,244 | 154 | 1,95,573 | 145 | 1,05,195 | 133 | 71,947 |
| 6 | 0.9975 | 172 | 4,43,119 | 163 | 1,96,404 | 154 | 1,05,642 | 141 | 72,253 |
| 7 | 0.9991 | 181 | 4,43,813 | 172 | 1,96,711 | 163 | 1,05,808 | 150 | 72,366 |
| 8 | 0.9997 | 190 | 4,44,068 | 181 | 1,96,824 | 172 | 1,05,868 | 158 | 72,408 |
| 9 | 0.9999 | 200 | 4,44,162 | 190 | 1,96,866 | 181 | 1,05,891 | 166 | 72,423 |
| 10 | 0.99995 | 209 | 4,44,197 | 200 | 1,96,882 | 190 | 1,05,899 | 175 | 72,429 |
| 11 | 0.99998 | 218 | 4,44,210 | 209 | 1,96,887 | 200 | 1,05,902 | 183 | 72,431 |
| 12 | 0.99999 | 227 | 4,44,215 | 218 | 1,96,889 | 1,05,903 | 72,432 | ||
| 13 | 0.99999 | 236 | 4,44,216 | 1,96,890 | 1,05,904 | 72,432 | |||
![]()
…(2)
Where,
xj takes the value between -13 to +13 to get a wide range of data points
Yj is the calculated (predicted/forecasted) data for each xj
xi = (-2,+1) corresponding to the cases (i) to (iv)
The total number of confirmed cases reported by India on day 100 (7th May, 2020) is 52,952. In case (i), day 100 is placed at the point x=-2 on the S curve and by extrapolating the data, we observe that the number of confirmed cases may cross 1,18,000 in the next 10 days and the total confirmed cases may reach a drastic number of 4,44,000 which becomes an alarming and a serious concern for the country. 99% of the saturation be observed on day 163 (9th July 2020) and 99.9% is expected to be completed on day 181 (25th July 2020). In case (ii), we relax the curve and assume that day 100 is placed at x=-1. In this scenario, 1,00,000 cases is expected to be reported in the next 9-10 days and that the total confirmed cases will be saturated to 1,96,889 which is less than half of the cases expected from case (i). 99% and 99.9% of the pandemic in India is expected to be seen on day 154 (28th June 2020) and 172 (16th July 2020) respectively. In case (iii) we assume that day 100 is placed exactly at the center with y=0.5, i.e. India is exactly at the mid-stage of the pandemic. This scenario expects that a total number of 105,900 cases are reported to be confirmed and that the 99% and 99.9% of the pandemic is expected to be observed on day 145 (19th June 2020) and day 163 (9th July 2020) respectively. In the last case we assume India has already been on the decreasing trajectory and hence the total confirmed cases is expected to saturate in the 70,000s. 99.9% of the pandemic is expected to be completed before 24th June 2020.
Table (3):
Comparison of actual reported cases in India on days 72, 81 and 9022 with the data predicted using the sigmoid function.
Day |
Actual reported |
Case (i) |
Case (ii) |
Case (iii) |
|---|---|---|---|---|
72 |
5,865 |
2,973 |
3,541 |
5,023 |
81 |
14,792 |
7,990 |
9,338 |
12,624 |
90 |
28,160 |
21,067 |
23,470 |
28,482 |
Among all these cases, case (iv) is very highly unlikely as there are no signs of decreasing trends in the number of cases. To analyse the remainder of the three cases, we compare the predicted data with the actual reported cases in the previous 3 weeks. The actual confirmed COVID-19 cases and the predicted cases using S curve on day 72, day 81 and day 90 for India are tabulated in Table 3 for comparison. From the table, it can be seen that the closest case representing the actual data in the previous three weeks is case (iii) with an average error of 10%. This data indicates that India is closer to case (iii) as compared to the other two cases which is a healthy sign. Also, by considering the end date for completion of 99.9% of the pandemic (in terms of time), case (iii) and case (i) predict the dates between 9th July and 27th July respectively having a difference of 2.5 weeks. The S curve corresponding to case (iii) can be managed with total confirmed cases predicted up to 1.06 lakh. Although no much difference in the ending time of the pandemic, if proper control measures are not followed, we may end up with the curve corresponding to case (ii) or case (i) where the total cases may get accumulated up to 4.4 lakh with stage 3 being inevitable across many parts in the country. With the extended lockdown period nearing, there could be serious concerns in handling the spread of the disease.
Other insights
Comparison of the data of different countries albeit useful to ascertain the forming trends, they may render incorrect insights due to the changes in demographics. Hence, one approach to compare data of all the countries is by considering the population of the country and the ration of the population affected by the novel coronavirus. Table 4 tabulates the peak average cases and peak average deaths calculated per million population of individual countries. The highest values of maximum average cases per million population are recorded in Spain, the USA, Italy and the UK (in decreasing order). India is way down at 0.34 average cases per million population. In terms of maximum fatalities, the highest values of maximum average deaths per million population are from the European countries of Spain, the UK and Italy. The Asian countries of China, Japan and South Korea have recorded the values at 0.03, 0.04 and 0.05 respectively. In this category also, India is on the lowest level with 0.01. But caution should be exercised because, for India, both these values are recorded on day 100. There could be all the possibilities of these numbers rising in the near future if proper measures are not taken. This work can also aid the policy makers to classify the zones according to the assumed case and hence take preventive measures to stop the transmission.
Table (4):
Comparison of maximum average confirmed cases and deaths (per million population) of different countries.
Sl. No. |
Country |
Maximum average cases (per million population) |
Maximum average deaths (per million population) |
|---|---|---|---|
1 |
United Kingdom |
31.6 (on day 98) |
4.73 (on day 98) |
2 |
Spain |
52.1 (on day 78) |
5.83 (on day 92) |
3 |
USA |
34.4 (on day 108) |
2.06 (on day 108) |
4 |
Italy |
37.14 (on day 88) |
5.05 (on day 94) |
5 |
China |
1.01 (on day 51) |
0.03 (on day 58) |
6 |
Japan |
1.07 (on day 112) |
0.04 (on day 114) |
7 |
South Korea |
2.91 (on day 52) |
0.05 (on day 88) |
8 |
India |
0.34 (on day 100) |
0.01 (on day 100) |
Prevention and Management
According to WHO, the major concern is to diagnose accurately and develop effective therapeutics against COVID-19. Many tests like nucleic acid detection, serology, virus whole genome sequencing, computed tomography, chest X-ray are available for the detection of COVID-1923–25. However, confirmation of these cases is based on detection of unique sequence of virus RNA by reverse transcription polymerase chain reaction (RT-PCR) and the genes targeted include N, S, E and RdRP26. For COVID-19 cases, the nucleic acids can be detected from nasal swab, pharyngeal swab, sputum, bronchoalveolar lavage, fibre bronchoscope brush biopsy, blood, feces and urine26,27. High accuracy is seen with nucleic acid based assay but they are expensive, needs sophisticated set up to run the test and the supply is limited. In such situations, serological tests aid to investigate large population but cross reactivity is a challenging concern28. Currently, there is no specific antivirals or vaccines for the treatment of COVID-19. Many drugs are estimated to become a potent candidate for treatment however studies suggesting their effectiveness are scanty29–31. Lopinavir/ritonavir were the first antivirals tried32, which interferes with viral polymerase and are protease inhibitors. Further, oseltamivir (neuraminidase enzyme inhibitor), remdesivir (RNA polymerase inhibitor), Nelfinavir (viral protease inhibitor) are under study. Low-cost antimalarial drugs like chloroquine and its derivative hydroxychloroquine (HCQ) are known to increase endosomal pH, alter glycosylation of angiotensin-converting enzyme 2 receptors and enhance the activity of regulatory T cell33,34. In a randomized clinical trial conducted, chloroquine performed better than lopinavir-ritonavir combination proving it to be a better treatment option35. On March 31 2020, the government of India recommended guidelines for usage of HCQ for clinical management of COVID-19 according to arrhythmic risk36. However the resistance to HCQ in mutating viral strains needs to be further explored. Passive antibody transfer is one of the most effective and traditional method, where the serum of patients who recovered from active viral infection is used to treat patients who may contract the disease in future. COVID-19 convalescent sera is used for prophylaxis and treatment37, however, inadvertent infection with another infectious agent is a dreaded complication38. Attempts are being made for development of vaccines and WHO has released a list of 8 candidate vaccines in clinical evaluation and 110 candidates in pre-clinical evaluation39. However, no vaccines are currently approved for treatment of COVID-19. The guidelines for treatment of COVID-19 are based on the existing measures for MERS and SARS-CoV as the nature of COVID-19 is unknown. Isolation, symptomatic treatment and supportive care remain as primary strategy for treating COVID-19 cases. Oxygen therapy or mechanical ventilation is initiated if the patient progresses to respiratory distress. As cytokine storm is commonly seen in critically ill COVID-19 cases, anti-inflammatory therapy should be initiated40.
Prevention still remains the main strategy to arrest the spread of infection. Screening at large scale can act as effective tool for preventing transmission but it is challenging and time consuming. Personal protective measures like performing hand hygiene, practicing social distancing, face mask not only protects the individual but also prevents the transmission of disease to susceptible population. Focusing on the susceptible populations like healthcare workers, children and the elderly, the government is constantly issuing guidelines and advising strict adherence to the same which contains the viral transmission within the country. However, international collaboration plays a key role in preventing the pandemic globally.
COVID-19 pandemic has put the whole world on check about the spread of the disease and practising social distancing. India has also been significantly affected by the virus and has completed 100 days since the first positive case was reported. This paper reviews India’s current and future scenarios with regard to managing the cases. A comparison of the current trends with that of the other countries are discussed and reviewed. A novel approach to view the changing trends of confirmed cases using a sigmoid function is elaborated. India’s current situation on the sigmoid curve is analyzed by considering different cases. By continuing the current efforts, the pandemic may end on 9th July 2020 with a maximum confirmed case of 105,900. However, with relaxation of lockdown regulations and inadequate awareness of social distancing, there are all the possibilities where the current situation can easily get deviated to case (ii) or case (i) which may result in excess of 4.4 lakh cases by the end of July 2020.
Unlike other complex models that involves mathematical modelling, the current work has successfully demonstrated the use of sigmoid function for forecasting the increased transmission of COVID-19. It is simple and can be effortlessly implemented by researchers and data scientists to assess the country’s progress in curbing the spread of the disease. In addition, the policy makers can also refer to the assumed cases and classify the zones accordingly to stop the transmission. The best possible approach is to undertake preventive measures by strictly adhering to the guidelines and policies set by the government. Practices of hand hygiene, social distancing, surveillance, and isolation are the only means to break the chain of transmission and control the pandemic.
ACKNOWLEDGMENTS
The authors are thankful to Mr. Sooraj Mohan, Manipal Institute of Technology, Manipal who has provided assistance for the statistical techniques.
CONFLICT OF INTEREST
The authors declare that there is no conflict of interest.
AUTHORS’ CONTRIBUTION
All listed author(s) have made a substantial, direct and intellectual contribution to the work, and approved it for publication.
FUNDING
None.
ETHICS STATEMENT
This article does not contain any studies with human participants or animals performed by any of the authors.
AVAILABILITY OF DATA
Not applicable.
- Van Doorn HR. Emerging infectious diseases. Medicine (Abingdon). 2014;42(1):60-63. https://doi.org/10.1016/j.mpmed.2013.10.014
- World Health Organization. Reducing animal-human transmission of emerging pathogens. https://www.who.int/health-topics/coronavirus/who-recommendations-to-reduce-risk-of-transmission-of-emerging-pathogens-from-animals-to-humans-in-live-animal-markets
- World Health Organization. No Title.; 2020. https://www.who.int/csr/don/12-january-2020-novel-coronavirus-china/en/.
- World Health Organization. Modes of Transmission of Virus Causing COVID-19: Implications for IPC Precaution Recommendations.; 2020.
- Xu Y, Li X, Zhu B, et al. Characteristics of pediatric SARS-CoV-2 infection and potential evidence for persistent fecal viral shedding. Nat Med. 2020;26(4):502-505. https://doi.org/10.1038/s41591-020-0817-4
- Hindson J. COVID-19: faecal–oral transmission? Nat Rev Gastroenterol Hepatol. 2020;17(5):259. https://doi.org/10.1038/s41575-020-0295-7
- Nouri-Vaskeh M, Alizadeh L. Fecal transmission in COVID-19: A potential shedding route. J Med Virol. 2020; n/a(n/a). doi:10.1002/jmv.25816
- Petropoulos F, Makridakis S. Forecasting the novel coronavirus COVID-19. PLoS One. 2020;15(3):e0231236.
- Perc M, Gorisek Miksic N, Slavinec M, Stozer A. Forecasting COVID-19. Front Phys. 2020;8:127.
- Postnikov EB. Estimation of COVID-19 dynamics “on a back-of-envelope”: Does the simplest SIR model provide quantitative parameters and predictions? Chaos, Solitons & Fractals. 2020;135:109841. doi:https://doi.org/10.1016/j.chaos.2020.109841
- Chen YC, Lu P-E, Chang CS, Liu T-H. A Time-dependent SIR model for COVID-19 with Undetectable Infected Persons. arXiv Quant Biol. 2020;1-18. doi:arXiv:2003.00122
- Ndairou F, Area I, Nieto JJ, Torres DFM. Mathematical modeling of COVID-19 transmission dynamics with a case study of Wuhan. Chaos, Solitons & Fractals. 2020;135:109846. doi:https://doi.org/10.1016/j.chaos.2020.109846
- Gupta R, Pandey G, Chaudhary P, Pal SK. SEIR and Regression Model based COVID-19 outbreak predictions in India. medRxiv. 2020; 20049825. doi:10.1101/2020.04.01.20049825
- Roda WC, Varughese MB, Han D, Li MY. Why is it difficult to accurately predict the COVID-19 epidemic? Infect Dis Model. 2020;5:271-281. doi:https://doi.org/10.1016/j.idm.2020.03.001
- Maleki M, Mahmoudi MR, Wraith D, Pho K-H. Time series modelling to forecast the confirmed and recovered cases of COVID-19. Travel Med Infect Dis. 2020; 101742. doi:https://doi.org/10.1016/j.tmaid.2020.101742
- Cuevas E. An agent-based model to evaluate the COVID-19 transmission risks in facilities. Comput Biol Med. 2020;121:103827. doi:https://doi.org/10.1016/j.compbiomed.2020.103827
- World Health Organization. Coronavirus Disease (COVID-19) Situation Report– 108; 2020.
- HealthManagement.org. Where Are the Most Effective Anti-COVID-19 Strategies?; 2020.
- Roser M, Ritchie H, Ortiz-Ospina E, Hasell J. Coronavirus (COVID-19) Cases. Our World in Data.
- Reid D. India confirms its first coronavirus case. CNBC.
- Central Bureau of Health Intelligence. National Health Profile. 2018; 2018.
- Ministry of Health and Family Welfare Government of India. COVID-19 Statewise Status.
- Udugama B, Kadhiresan P, Kozlowski HN, et al. Diagnosing COVID-19: The Disease and Tools for Detection. ACS Nano. 2020;14(4):3822-3835. doi:10.1021/acsnano.0c02624
- World Health Organization. Critical Preparedness, Readiness and Response Actions for COVID-19.; 2020. https://www.who.int/publications-detail/critical-preparedness-readiness-and-response-actions-for-covid-19.
- Rabaan AA, Al-Ahmed SH, Sah R, et al. SARS-CoV-2/COVID-19 and Advances in Developing Potential Therapeutics and Vaccines to Counter this Emerging Pandemic Virus – A Review. Preprints. 2020; 2020040075. doi:10.20944/preprints202004.0075.v1
- World Health Organization. Laboratory Testing for 2019 Novel Coronavirus (2019-NCoV) in Suspected Human Cases.; 2020. https://www.who.int/publications-detail/laboratory-testing-for-2019-novel-coronavirus-in-suspected-human-cases-20200117.
- Dhama K, Sharun K, Tiwari R, et al. Coronavirus Disease 2019 – COVID-19. Preprints. 2020;2020030001. doi:10.20944/preprints202003.0001.v2
- World Health Organization. Advice on the Use of Point-of-Care Immunodiagnostic Tests for COVID-19.; 2020. https://www.who.int/news-room/commentaries/detail/advice-on-the-use-of-point-of-care-immunodiagnostic-tests-for-covid-19
- Shetty R, Ghosh A, Honavar S, Khamar P, Sethu S. Therapeutic opportunities to manage COVID-19/SARS-CoV-2 infection: Present and future. Indian J Ophthalmol. 2020;68(5):693-702. doi:10.4103/ijo.IJO_639_20
- Phadke M, Saunik S. COVID-19 treatment by repurposing drugs until the vaccine is in sight. Drug Dev Res. 2020; n/a(n/a). doi:10.1002/ddr.21666
- Pant S, Singh M, Ravichandiran V, Murty USN, Srivastava HK. Peptide-like and small-molecule inhibitors against Covid-19. J Biomol Struct Dyn. 2020;1-10. doi:10.1080/07391102.2020.1757510
- Muralidharan N, Sakthivel R, Velmurugan D, Gromiha MM. Computational studies of drug repurposing and synergism of lopinavir, oseltamivir and ritonavir binding with SARS-CoV-2 protease against COVID-19. J Biomol Struct Dyn. 2020;1-6. doi:10.1080/07391102.2020.1752802
- Sarma P, Kaur H, Kumar H, et al. Virological and clinical cure in COVID-19 patients treated with hydroxychloroquine: A systematic review and meta-analysis. J Med Virol. 2020; n/a(n/a). doi:10.1002/jmv.25898
- Singh AK, Singh A, Shaikh A, Singh R, Misra A. Chloroquine and hydroxychloroquine in the treatment of COVID-19 with or without diabetes: A systematic search and a narrative review with a special reference to India and other developing countries. Diabetes Metab Syndr Clin Res Rev. 2020;14(3):241-246. doi:https://doi.org/10.1016/j.dsx.2020.03.011
- Kapoor A, Pandurangi U, Arora V, et al. Cardiovascular risks of hydroxychloroquine in treatment and prophylaxis of COVID-19 patients: A scientific statement from the Indian Heart Rhythm Society. Indian Pacing Electrophysiol J. 2020. doi:https://doi.org/10.1016/j.ipej.2020.04.003
- Ministry of Health and Family Welfare Government of India. Revised Guidelines on Clinical Management of COVID – 19.; 2020.
- Sparrow E, Friede M, Sheikh M, Torvaldsen S. Therapeutic antibodies for infectious diseases. Bull World Health Organ. 2017;95(3):235-237. doi:10.2471/BLT.16.178061
- Casadevall A, Pirofski L. The convalescent sera option for containing COVID-19. J Clin Invest. 2020;130(4):1545-1548. doi:10.1172/JCI138003
- World Health Organization. Draft Landscape of COVID-19 Candidate Vaccines.; 2020. https://www.who.int/who-documents-detail/draft-landscape-of-covid-19-candidate-vaccines
- Cascella M, Rajnik M, Cuomo A, Dulebohn SC, Napoli R Di. Features, Evaluation and Treatment Coronavirus (COVID-19). In: StatePearls. StatPearls Publishing LLC; 2020. https://www.ncbi.nlm.nih.gov/books/NBK554776/
© The Author(s) 2020. Open Access. This article is distributed under the terms of the Creative Commons Attribution 4.0 International License which permits unrestricted use, sharing, distribution, and reproduction in any medium, provided you give appropriate credit to the original author(s) and the source, provide a link to the Creative Commons license, and indicate if changes were made.