

ISSN: 0973-7510
E-ISSN: 2581-690X
Bluetongue (BT) is an economically important contagious viral disease transmitted by insect vectors of Culicoides species affecting both domestic and wild ruminants caused by Genus Orbivirus of Reoviridae family. Present in vivo study for the first time conducted to understand the role of oxidative stress and acute phase proteins in the pathogenesis of endothelial injury in target blood vessels of BTV-4 infected sheep. Twelve sheep of either sex were divided into two groups of six animals each and infected intradermally at multiple sites in the neck region with 6×105.9 TCID50/ml of BTV-4 and animals of control group were inoculated with uninfected tissue culture fluid. Animals were sacrificed at 3, 7, 15, 28, 60, and 90 days post infection (dpi) and postmortem examination was conducted. Oxidative stress parameters like LPO, SOD, GPO and catalase in the blood vessels, hemolysate and serum were estimated. Oxidative stress parameter like LPO was upregulated and anti-oxidant parameters like SOD and GPO were downregulated in blood vessels homogenates, hemolysate and serum of BTV-4 infected animals than uninfected control. This shows the role of oxidative stress in causing endothelial cell damage during BTV infection. Acute phase proteins like CRP and fibrinogen in serum and plasma were estimated and found upregulated in BTV-4 infected animals, which shows that inflammatory changes during the disease causes vascular damage. Prothrombin time was estimated in plasma of BTV-4 infected animals and was prolonged in BTV infected animals indicating coagulation disorder. Increased oxidative stress and fibrinogen, and prolonged prothrombin time indicated the coagulation disorders induced by BTV infection by causing endothelial cell damage and severe vascular disease results in congestion, haemorrhages and edema in the blood vessels and other target organs in sheep.
Pathogenesis, Endothelial Injury, Bluetongue Virus, Sheep, Oxidative Stress, Acute Phase Proteins
Bluetongue (BT) is a viral haemorrhagic disease of wild and domestic animals like sheep, cattle, goat, deer, camel, white-tailed deer, pronghorn, ilama, and alpaca caused by Bluetongue virus (BTV), genus Orbivirus of Reoviridae family.1,2 Infection by this virus causes much economic losses due to high mortality and morbidity. Till date, there are 28 BTV serotypes have been described.1 The virus gets transmitted to animals through bite of blood-sucking midges, which belong to genus Culicoides of Ceratopogonidae family. The virus gets replicates with in nearby lymph nodes after skin instillation of the virus in the animal.3 Then, virus goes to blood and organs like lymph nodes, spleen and lungs4 and replicates within endothelial cells (ECs) of the vessels of these organs.5 Bluetongue affected sheep showed clinical signs like pyrexia, edema of lips, nose and face, severe swelling and cyanosis of tongue (bluetongue), sore muzzle, ulcers in lips and tongue, serous nasal discharge, later become mucopurulent, enteritis, congestion of coronary bands, lameness, and death.2
The oxidative stress is defined as an increase in reactive oxygen species (ROS), such as superoxide, due to the increased production or reduced metabolism. Oxidative stress is characterized as an increased oxidant compound production and/or decreased antioxidant scavenging mechanism. It leads to increased amounts of biomolecules, which are oxidized and causes tissue damage. Research evidence proves that stress due to oxidation has significant role in development of endothelium impairment. The fall in nitric oxide (NO) bioavailability is caused by reduced endothelial nitric oxide synthase (eNOS) expression, a paucity of eNOS substrates, eNOS inactivation, and faster NO degradation. Physiological ROS production is necessary for maintaining vascular homeostasis.6
Acute phase response can be defined as complex body reaction in response to cytokines released during any disturbance like infection or tissue injury in the body.7 Important acute phase proteins in the body are fibrinogen, serum amyloid, haptoglobin, C-reactive protein (CRP), and ceruloplasmin.8 In the present study, fibrinogen and CRP levels were evaluated in plasma and serum of animals. Plasma protein fibrinogen acts as a substrate for forming fibrin and as matrix for inflammatory cells to migrate during the process of tissue repair.
Collectively, the levels of these acute phase proteins will give idea about the degree of infection and extent of tissue damage indicating innate immune responses for preventing infection and initiating inflammatory processes. Prothrombin time is the time in seconds taken by plasma to form fibres and clot after adding of thromboplastin (made of phospholipid, calcium and tissue factor) reagent, which can be used to examine the extrinsic pathways of coagulation to know the extent of endothelial injury induced by BTV and deficiency of certain coagulation factors and fibrinogen.9
The oxidative stress parameter like lipid peroxidation is measured as malondialdehyde (MDA), aldehydic product.10 This increased MDA levels are the reason for oxidative stress leading to cytotoxicity, which was proved by earlier studies.11 This oxidative stress is secondary to inflammation in the body as inflammatory cells gets activated, which are considered as good source of ROS leading to oxidative damage of cells by increasing the lipid peroxidation and finally increasing the tissue permeability.12 The antioxidant defense mechanisms are done by some enzymatic and non-enzymatic compounds like reduced glutathione (GSH) and superoxide dismutase (SOD), glutathione-stranferase (GST), and glutathione peroxidase (GPX), respectively and prevent the body against the oxidative damage by free radicals.13 Superoxide dismutase is the antioxidant enzyme, which catalyze the highly reactive superoxide anion dismutation to O2 and H2O.14 Catalase reacts with hydrogen peroxidase (H2O2) and neutralizes them to water and molecular oxygen.15 Most important antioxidant defense mechanism is considered to be glutathione. The GPX protect cells against oxidative damage by reducing hydroperoxides using reduced glutathione (GSH).16 When body could not made balance between antioxidants and free radicals, it terminates into oxidative stress causing injury to the cells due to free radicals. This oxidative stress can also be correlated with increased acute phase proteins showing the role of inflammation and oxidative stress in causing cell damage.
Molecular process of injury to the endothelium induced by bluetongue viral infection is not clear till date. Being an endotheliotropic virus, it is essential to know the pathogenesis of endothelial injury induced by bluetongue virus to design the therapeutic and control strategies. Therefore, the present study was proposed with the objective that to study the correlation between oxidative stress and injury of endothelial cells in BTV-4 infected sheep.
Experimental design
Twelve sheep of either sex were procured from local farmers and screened negative for BTV antibodies using IDEXX Bluetongue virus (BTV) VP7 Antibody Test Kit. These animals were housed in insect proof enclosures. Deworming of these animals was done by administering albendazole and ivermectin and their health was monitored on regular basis. The animals were divided into two groups of 6 animals in each group in compliance with Institutional Bio-Safety Committee (IBSC) and Committee for the Purpose of Control and Supervision of Experiments on Animals (CPCSEA) guidelines. Six animals of Group-1 were infected intradermally at multiple sites in the neck region with 6 × 105.9 TCID50/ml of BTV-4 and animals of control group were inoculated with uninfected tissue culture fluid, and that day was considered as 0 day of inoculation. Blood samples were collected at 3, 5, 7, 15, 21, 28, 60, and 90 days post infection (dpi) from both the infected and control animals. Animals were euthanized by an intravenous administration of Thiopentone sodium (Thiosol sodium 1 g, Neon laboratories Ltd., India) at 3, 7, 15, 28, 60, and 90 days post infection. After sacrifice of the animals, postmortem examination was conducted and major target blood vessels like base of pulmonary artery (Figure 1A and 1B) and base of aorta (Figure 1C and 1D) were collected for further laboratory investigations.
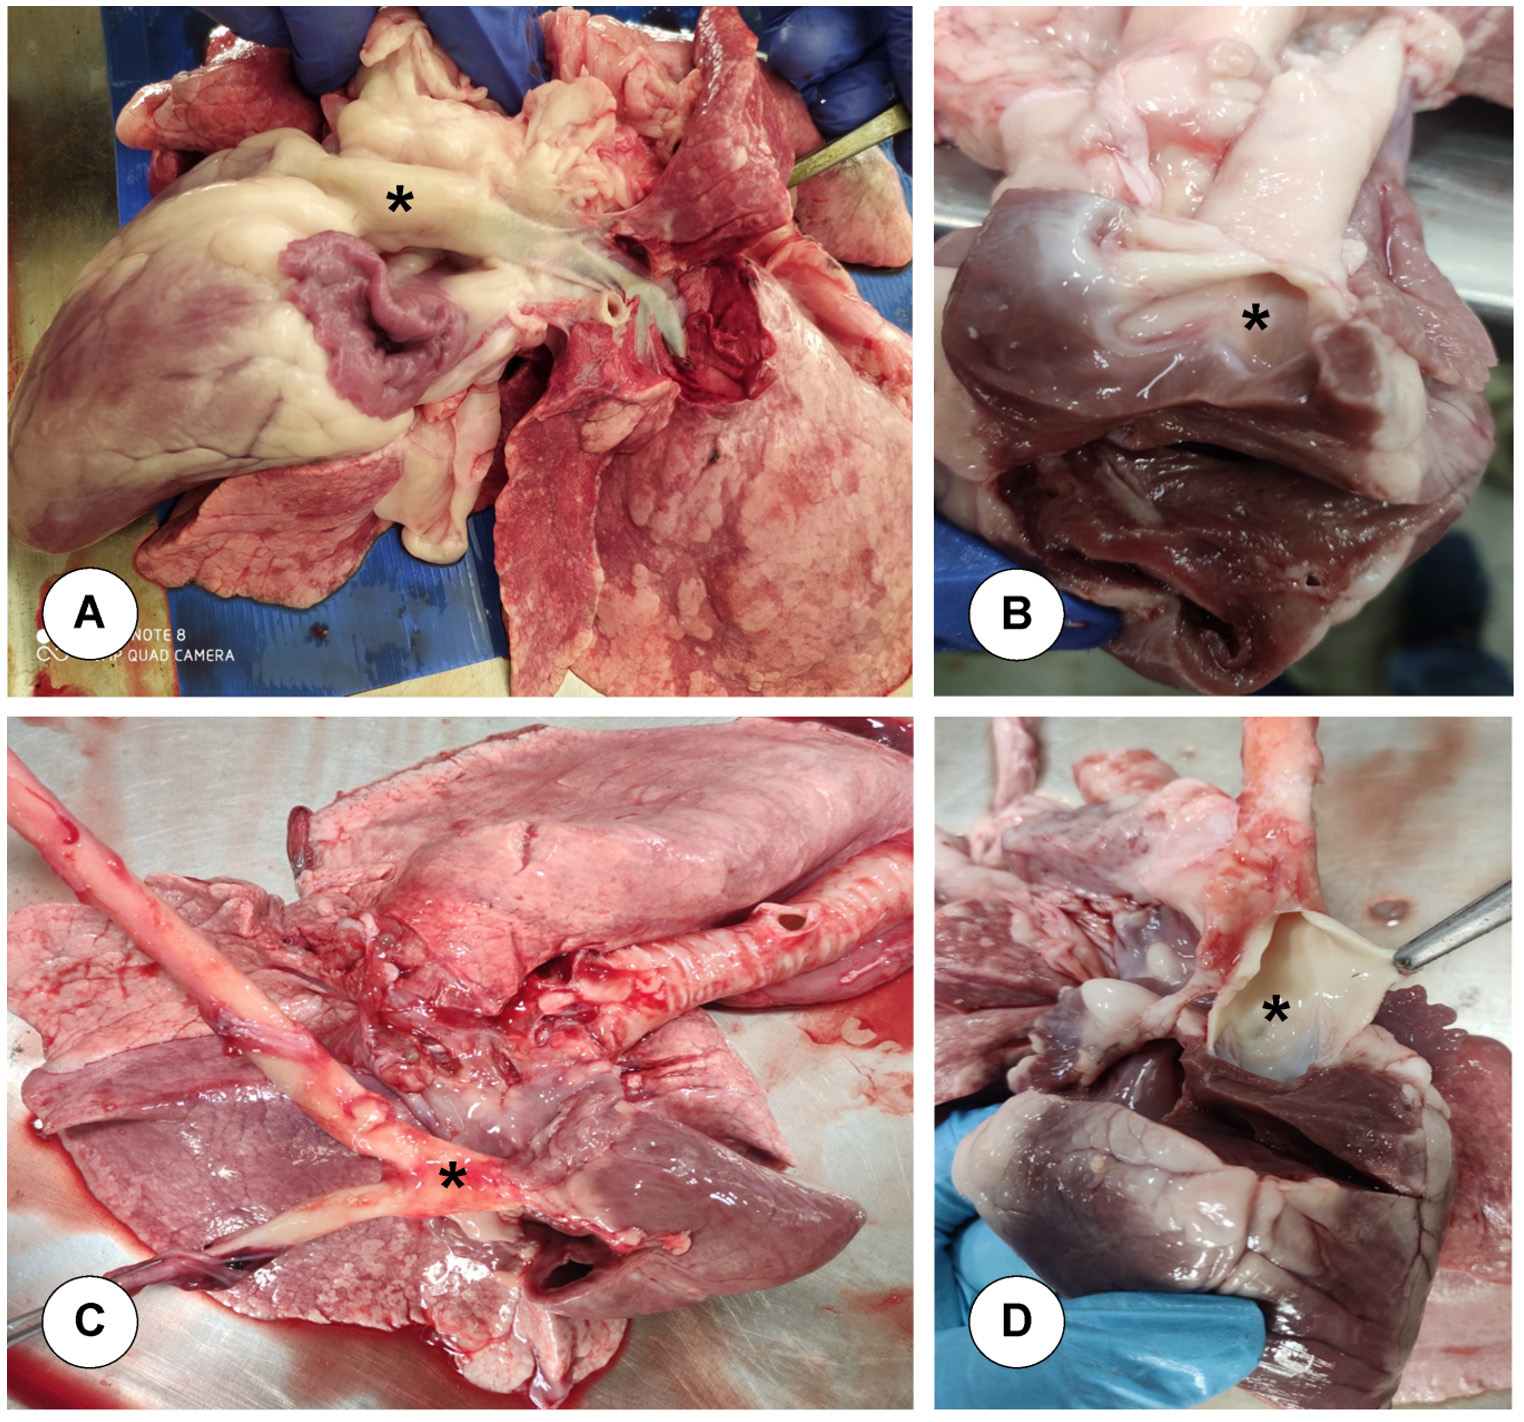
Figure 1. Collection of target blood vessels. A & B. Base of pulmonary artery: Leaves from right ventricle and enters into lungs. C & D. Base of aorta: Leaves from left ventricle
Estimation of oxidative stress parameters
Tissue homogenates (10%) of blood vessels like base of aorta and base of pulmonary artery, blood hemolysate (10%), and serum were used for estimating the parameters like lipid peroxidase (LPO), superoxide dismutase (SOD), glutathione peroxidase (GPO), and catalase (CAT).
Lipid peroxidation (LPO)
The level of lipid peroxidation was measured in terms of MDA (malondialdehyde) production following Thiobarbituric acid (TBA) method (Shafiq-U-Rehman). One ml of 10% blood hemolysate and homogenate (1 ml) was taken and 1 ml of 10% TCA was mixed with it. The solution made was centrifuged at 2500 rpm for 10 minutes. One ml of supernatant (1 ml) was taken from it and mixed with equal quantity of 0.67% TBA. Blank was prepared by adding all the reagents except samples with equal volume of distilled water. Absorbance for this solution was taken at 535 nm.
LPO (nM/mg protein) = (OD/Extincion Coefficient) × (total volume of reaction mixture)/ (Amount of sample taken) X (1/mg of protein)
Superoxide dismutase (SOD) estimation
The level of SOD was measured by following the method described by Madesh and Balasubramanian. Superoxide was generated by auto-oxidation of pyrogallol and then inhibition of superoxide-dependent conversion of tetrazolium dye MTT [3-(4-5 dimethyl thiazol 2-xl)2,5-diphenyl tetrazolium bromide] to formazan. This reaction was measured at 570 nm. At the end of the reaction, dimethyl sulfoxide (DMSO) was added in the reaction, which helps in the solubilization of the formazan formed. For many hours, the colour of the mixture was stable and was expressed as SOD units [one unit of SOD is the protein amount, which is required to decrease the MTT reduction by 50%].
Calculation:
The level of SOD was expressed as units/mg of protein.
Y% = (OD of test / OD of control) × 100
SOD (Units/ml) = (50 × Dilution Factor) / Y%
Y% = % inhibition of MTT reduction by SOD.
Glutathione peroxidase (GPO)
The glutathione peroxidase activity was measured by the method described by Paglia and Valentine.17 The mixture was prepared by adding 2.48 ml of phosphate buffer with EDTA, 0.1 ml of NADPH, 0.1 ml of GSH, 0.01 ml of sodium azide and finally 4.6 U of glutathione reductase. The reaction started by adding 0.1 ml of H2O2 to the mixture. Absorbance change was read for 3 min at 340 nm.
Catalase (CAT)
Catalase (CAT) was estimated by commercial catalase (CAT) fluorimetric assay kit (Cat No. E-BC-F006; Elabscience Bionovation Inc., Texas, USA), in which a microplate of 96 wells was given. Standard, samples, reagent 2 were added into the wells of plate as per the procedure given in the kit.
Estimation of acute phase proteins in serum and plasma
At each time interval, acute phase proteins (ACP) were estimated using commercially available kits like C-reactive protein (CRP) in serum, and fibrinogen in plasma samples.
Estimation of C-reactive protein (CRP)
Serum and plasma samples from 3, 7, 15, 21, 28, 60, and 90 dpi of BTV-infected and control animals were used for estimating the CRP using commercial sheep C-reactive protein, CRP GENLISATM ELISA kit (Cat No. KLS0163; KRISHGEN Biosystems, Biotechnology company, Maharashtra, India). Eight standards were made with serial dilutions and concentrations of 5000, 2500, 1250, 625, 312.5, 156.25, and 78.13 pg/ml. All these standards and samples for about 100 µl were added in duplicate wells in the ELISA plate and incubated for 90 min at 37°C. Then, 100 µl of working biotinylated antibody was added in all the wells after proper washing and incubated for 50 min at 37°C. Then, the plate was washed again and 100 µl of working solution of streptavidin-HRP solution was added in each well and plate was incubated for 50 min at 37°C. Then, 90 µl of TMB substrate was added in each well after proper washing, which gave blue colour and lastly stop solution for about 50 µl was added in all the wells resulting in yellow colour formation. The plate was then immediately read at 450 nm by Thermo Scientific Multiskan GO spectrophotometer.
Estimation of fibrinogen in plasma
Fibrinogen concentration was estimated by quantitative turbidimetric immunoassay using Quantia fibrinogen kit (Coral clinical system, Goa, India). A mixture was made by adding 500 µl of quantia fibrinogen activation buffer (R1) and 20 µl of working standard of 50 mg/dl concentration. Similarly, the mixture was made for other four standard concentrations up to 1.5 mg/dl and samples were kept for 5 min at 37°C, after which absorbance (A1) was taken at 340 nm wavelength. Finally, 100 µl of quantia-fibrinogen reagent (R2) was added in all the tubes with gentle mixing and absorbance (A2) was taken after 5 min. The ∆A (A2-A10) for all the five standard dilutions were calculated and standard curve was made to show absorbance versus standard concentration. Similarly, ∆A was calculated for all the plasma samples from different dpi and fibrinogen concentration was calculated from the equation derived from the standard curve.
Determination of prothrombin time
Prothrombin time was determined by sensitive thromboplastin reagent Uniplastin® (Cat No. 1020; Tulip Diagnostics (P) Ltd, Goa, India). Uniplastin reagent was prewarmed at 37°C for 3-5 min. Plasma samples up to 0.1 ml were prewarmed at 37°C for 3-5 min. In 0.1 ml of prewarmed plasma sample, 0.2 ml of uniplastin reagent was added with gentle shaking and stopwatch was started. Stopwatch was stopped as soon as the first fibrin clot was visible in the tube and time was noted. This is the time for the plasma to get clotted known as prothrombin time.
Histopathology
The base of pulmonary artery and base of aorta were collected in 10% neutral buffered formalin for histopathological examination. The tissues after all the processes were paraffin wax embedded and 4-5 μl thickness was cut and taken for Hematoxylin and Eosin (H&E) staining as described by Luna.18 Histopathological lesions were examined.
Immunohistochemistry for demonstration of BTV antigen
BTV antigen localisation was demonstrated in formalin fixed tissues of base of aorta and base of pulmonary artery by indirect immunoperoxidase technique (IPT). Briefly, the protocol as follows, the tissue sections were de-paraffinised with 2 changes of fresh xylene and rehydrated through serial changes in graded alcohols followed by gently rinsing in distilled water (DW). Heat induced antigen retrieval was performed by immersing the tissue sections in 10 mM sodium citrate buffer (pH 6.0), in a microwave resistant coupling jar and heated for 15 min (3 cycles of 5 min each) in microwave oven. Then, the slides were washed with PBS and incubated in freshly prepared 3% H2O2 in 80% methanol for 30 min in dark chamber to quench the endogenous peroxidase. The sections were covered with 5% normal goat serum (Invitrogen; product no. 016201) in PBS (pH 7.4) for blocking of non-specific antigenic sites. Then, the slides were incubated in humidified chamber for 1 hour at RT, followed by washing in PBS (3 times of 5 min each). The tissue sections were covered with hyper-immune serum against BTV-1 core antigen raised in rabbit, and incubated overnight in humidified chamber at 4°C. Then, the slides were washed thrice with PBS for 5 min each. The slides were incubated with peroxidase-conjugated goat anti-rabbit secondary antibodies (Sigma-Aldrich, St. Louis, Missouri, USA) for 1 hour at 37°C, followed by washing thrice in PBS for 5 min each. To demonstrate the immunolabeling, the slides were incubated with ImmPACT™ DAB peroxidase substrate (Vector Laboratories, Inc., Burlingame, CA, USA) for 30-60 seconds and washed with DW. The slides were counter stained with Mayer’s haematoxylin for 2 min and rinsed in tap water. The sections were covered with CC mount (Sigma-Aldrich, St. Louis, Missouri, USA) and slides were dried at RT for 45 min to 1 hour. The sections were examined under the microscope for positive signals.
RNA extraction
The base of aorta and base of pulmonary artery were collected in each sacrifice and RNA was extracted from these tissues using TRIZOL method. The RNA was quantified by NanoDropND-1000 spectrophotometer (Nanotechnologies, USA) and 1000 ng/μl concentration of RNA was used for cDNA synthesis.
Complementary DNA (cDNA) synthesis
The cDNA was synthesized with the uniform RNA concentration using Verso cDNA synthesis kit (Thermo scientific, USA). The RNA template (1000 ng) was added along with the RNA primers for reverse transcription reaction. Other components of the reaction mixture were also added accordingly. This reaction mixture was kept in thermocycler (Mastercycler Personal, Eppendorf, Germany) at 42°C for 40 min and then at 95°C for 2 min. The synthesized cDNA was then stored at -20°C till use.
Screening of BTV NS1 gene by Nested PCR
The cDNA was synthesized from RNA of the tissues collected and utilized as template for amplifying the BTV NS1 gene using gene specific primers for conducting first stage of amplification. Second round of amplification, in which nested PCR was done by taking the final amplified product of the first round of amplification instead of cDNA. The amplified product obtained from the PCR reaction was visualised on 1.5% agarose gel (Sigma-Aldrich, USA) prepared using 1x Tris-borate-EDTA (TBE) buffer and mixing ethidium bromide (0.5 μg/ml). The gel was then visualized by Gel documentation system (Azure biosystem-c300, USA) for visualizing bands of the amplicons.
| Gene | Primer sequence (5’-3’) | Product Length (bp) | Annealing temperature (°C) |
|---|---|---|---|
| First round of amplification | |||
| BTV-NS1 | GTT CTC TAG TTG GCA ACC ACC | 210 | 58 |
| BTV-NS1 | AGG CCA GAC TGT TTC CCG AT | ||
| Second round of amplification | |||
| BTV-Nest | GCA GCA TTT TGA GAG AGC GA | 101 | 62 |
| BTV-Nest | CCC GAT CAT ACA TTG CTT CCT | ||
Statistical analysis
The data were analyzed using the statistical analysis program GraphPad Prism, Version 5.0 (GraphPad Software Inc. San Diego, CA, USA). The mean of the BTV-infected and uninfected control groups at specified time intervals were calculated and expressed as mean ± standard error. The two-way ANOVA followed by Tukey’s post-hoc test was computed to know the effects of BTV-1. For all comparisons, differences were considered significant at P≤0.05.
Clinical signs
Elevated temperature and serous nasal discharge were seen in initial period of infection while in the later stage of infection, the nasal discharge was seen to be mucoprulent and conjunctiva were congested.
Gross lesions
Grossly, on the base of pulmonary artery, mild congestion was seen on 3 dpi. Haemorrhages were observed on base of pulmonary artery and on the papillary muscles in left ventricle of heart at 7 dpi in BTV- infected animal.
Histopathological lesions
The junction of pulmonary artery and heart from uninfected control animal did not show any histopathological lesion in blood vessels (Figure 2A). On 3 dpi, BTV-4 infected animal showed mild degeneration and necrosis in the base of pulmonary artery (Figure 2B). On 7 dpi, severe serosal haemorrhages and marked infiltration of mononuclear cells (MNCs) in between the myocardial fibres were seen in the junction of pulmonary artery and heart (Figure 2C). Lungs showed severe interstitial pneumonia. On 15 dpi, junction of pulmonary artery and heart showed marked degeneration and necrosis of cardiac muscle fibres with infiltration of mononuclear cells in between the cardiac muscle fibres (Figure 2D). Pulmonary arteriole of lungs showed sloughed endothelial cells and inflammatory cells in lumen. Necrosis and loss of muscular layer were seen in pulmonary artery of lungs with haemorrhages in serosa. Tunica intima of pulmonary artery showed necrosis with nuclear debris at 21 dpi (Figure 2E).
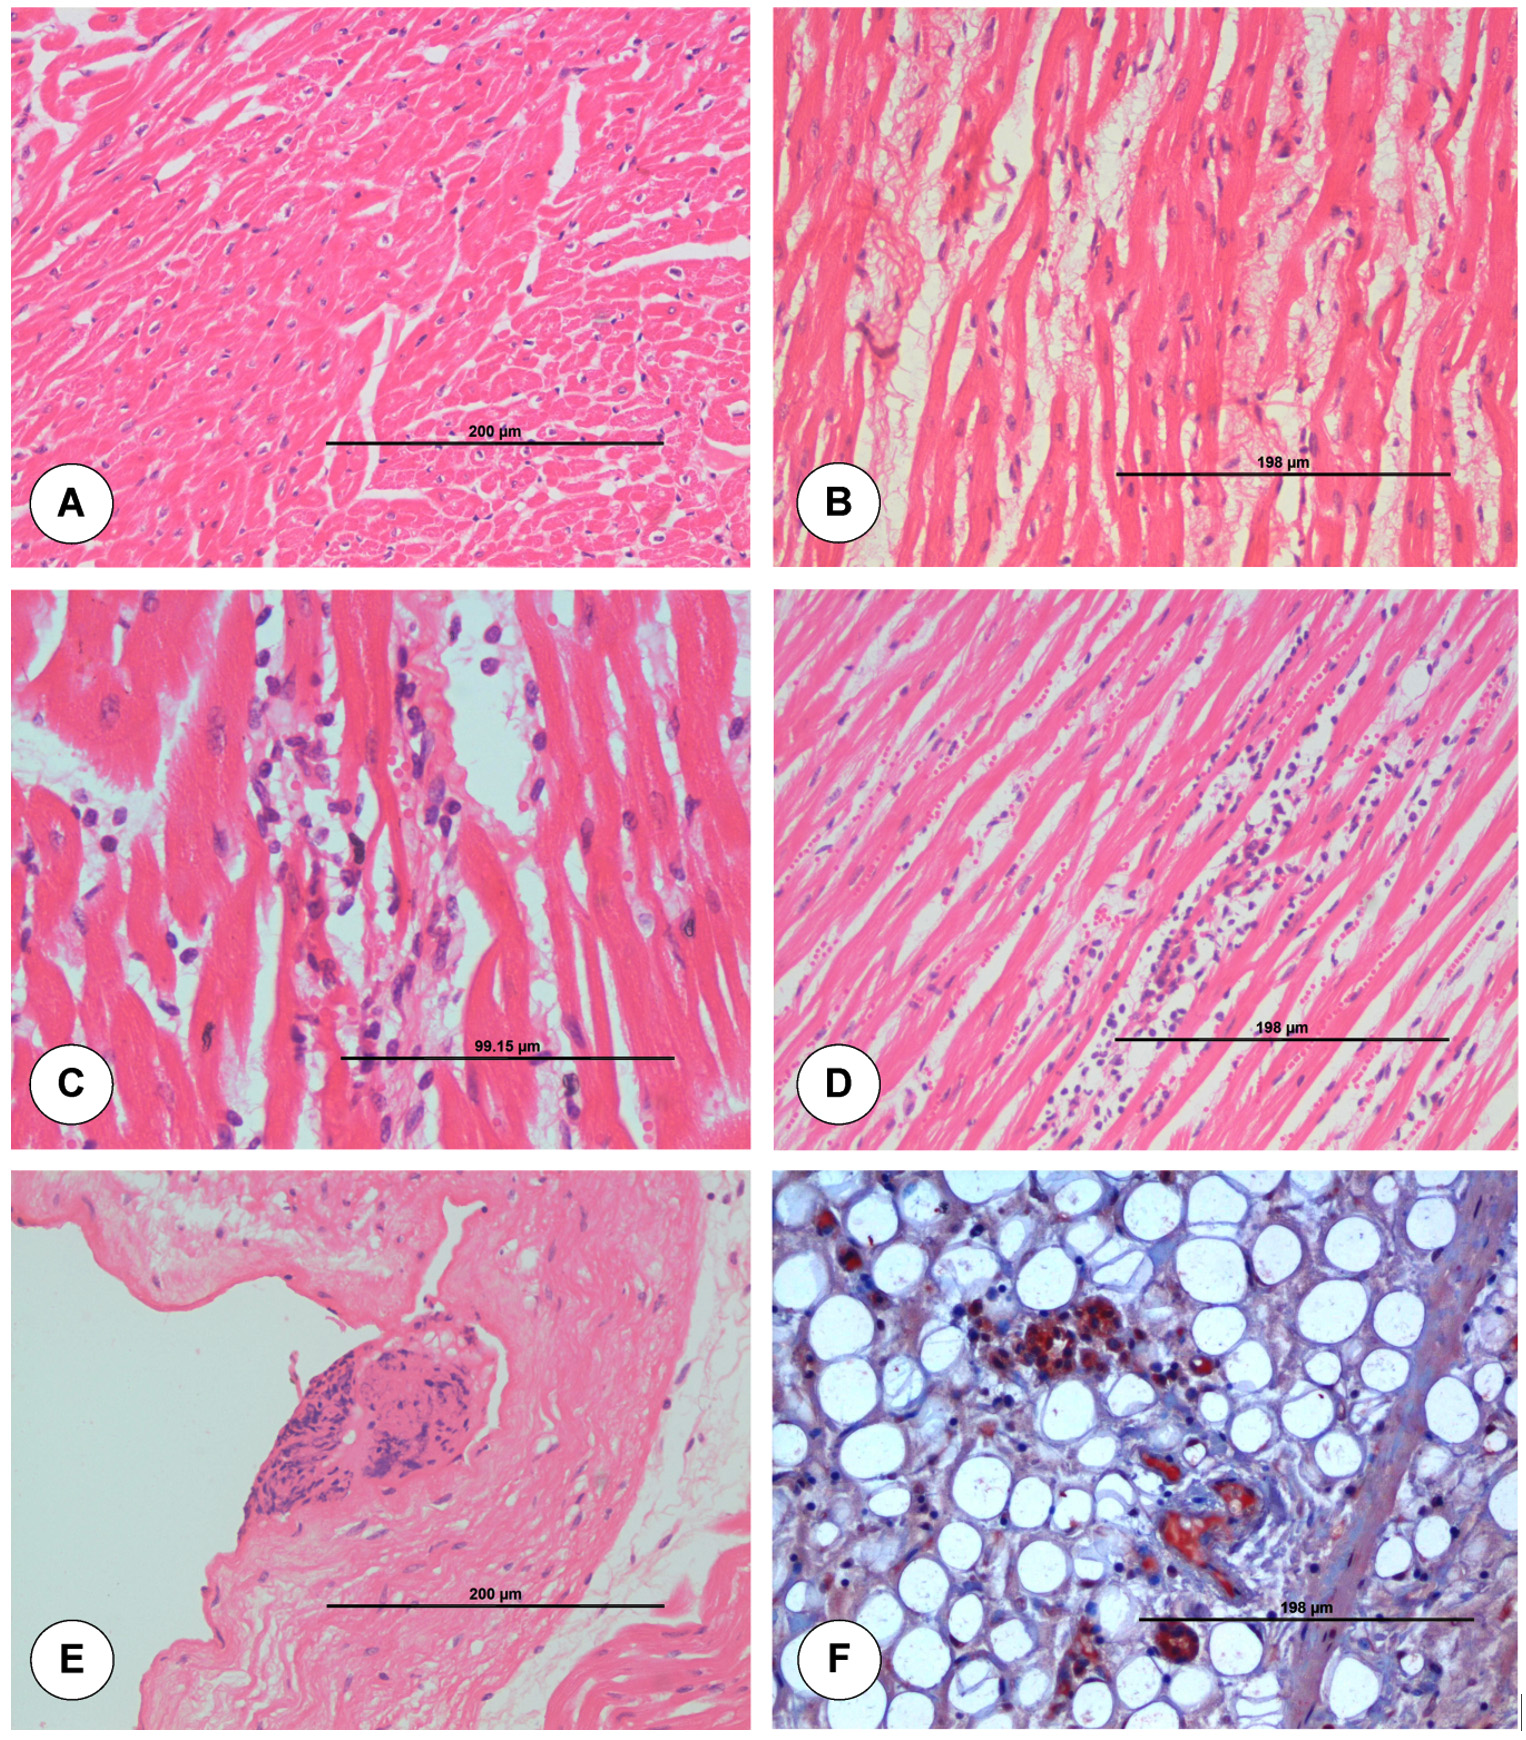
Figure 2. Histopathological lesions at the junction of base of pulmonary artery and right ventricle in uninfected control (A) and BTV-4 infected (B-F) groups. A. Transverse section of normal cardiac muscle fibres. H&E x200. B. Moderate degeneration of myocardial fibres at 3 dpi. H&E x200. C. Marked infiltration of mononuclear cells in between the myocardial fibres with degeneration at 7 dpi. H&E x400. D. Congestion of myocardial capillaries and infiltration of mononuclear cells between cardiac muscle fibres at 15 dpi. H&E x200. E. Tunica intima of pulmonary artery showed necrosis with nuclear debris at 21 dpi. H&E x200. F. Positive immunolabelling of BTV antigen in macrophages and endothelial cells of capillaries at 7 dpi. IP-DAB-MH x200.
The junction of aorta and heart from uninfected control animal did not show any histopathological lesion in blood vessels (Figure 3A). Mild degeneration of muscle fibres within the tunica medial layer of aorta was seen. Vacuolar degeneration was seen in the subintimal and tunica medial layer of aorta (Figure 3B). On 7 dpi, aorta showed thickening of tunica intima with swollen ECs and degeneration within tunica medial layer. Necrosis, perivascular cuffing (PVC) with MNCs, severe infiltration of MNCs in between the cardiac muscle fibres and degeneration of cardiac muscle fibres were noticed in the junction of aorta and heart (Figure 3C). On 15 dpi, junction of aorta and heart showed degeneration and necrosis of cardiac muscle fibres with infiltration of MNCs in between the cardiac muscle fibres. Aorta showed intimal thickening and infiltration of MNCs in subintimal layer with degeneration of muscle fibres (Figure 3D). Base of aorta and heart showed infiltration of MNCs in myocardial fibres at 21 dpi (Figure 3E).
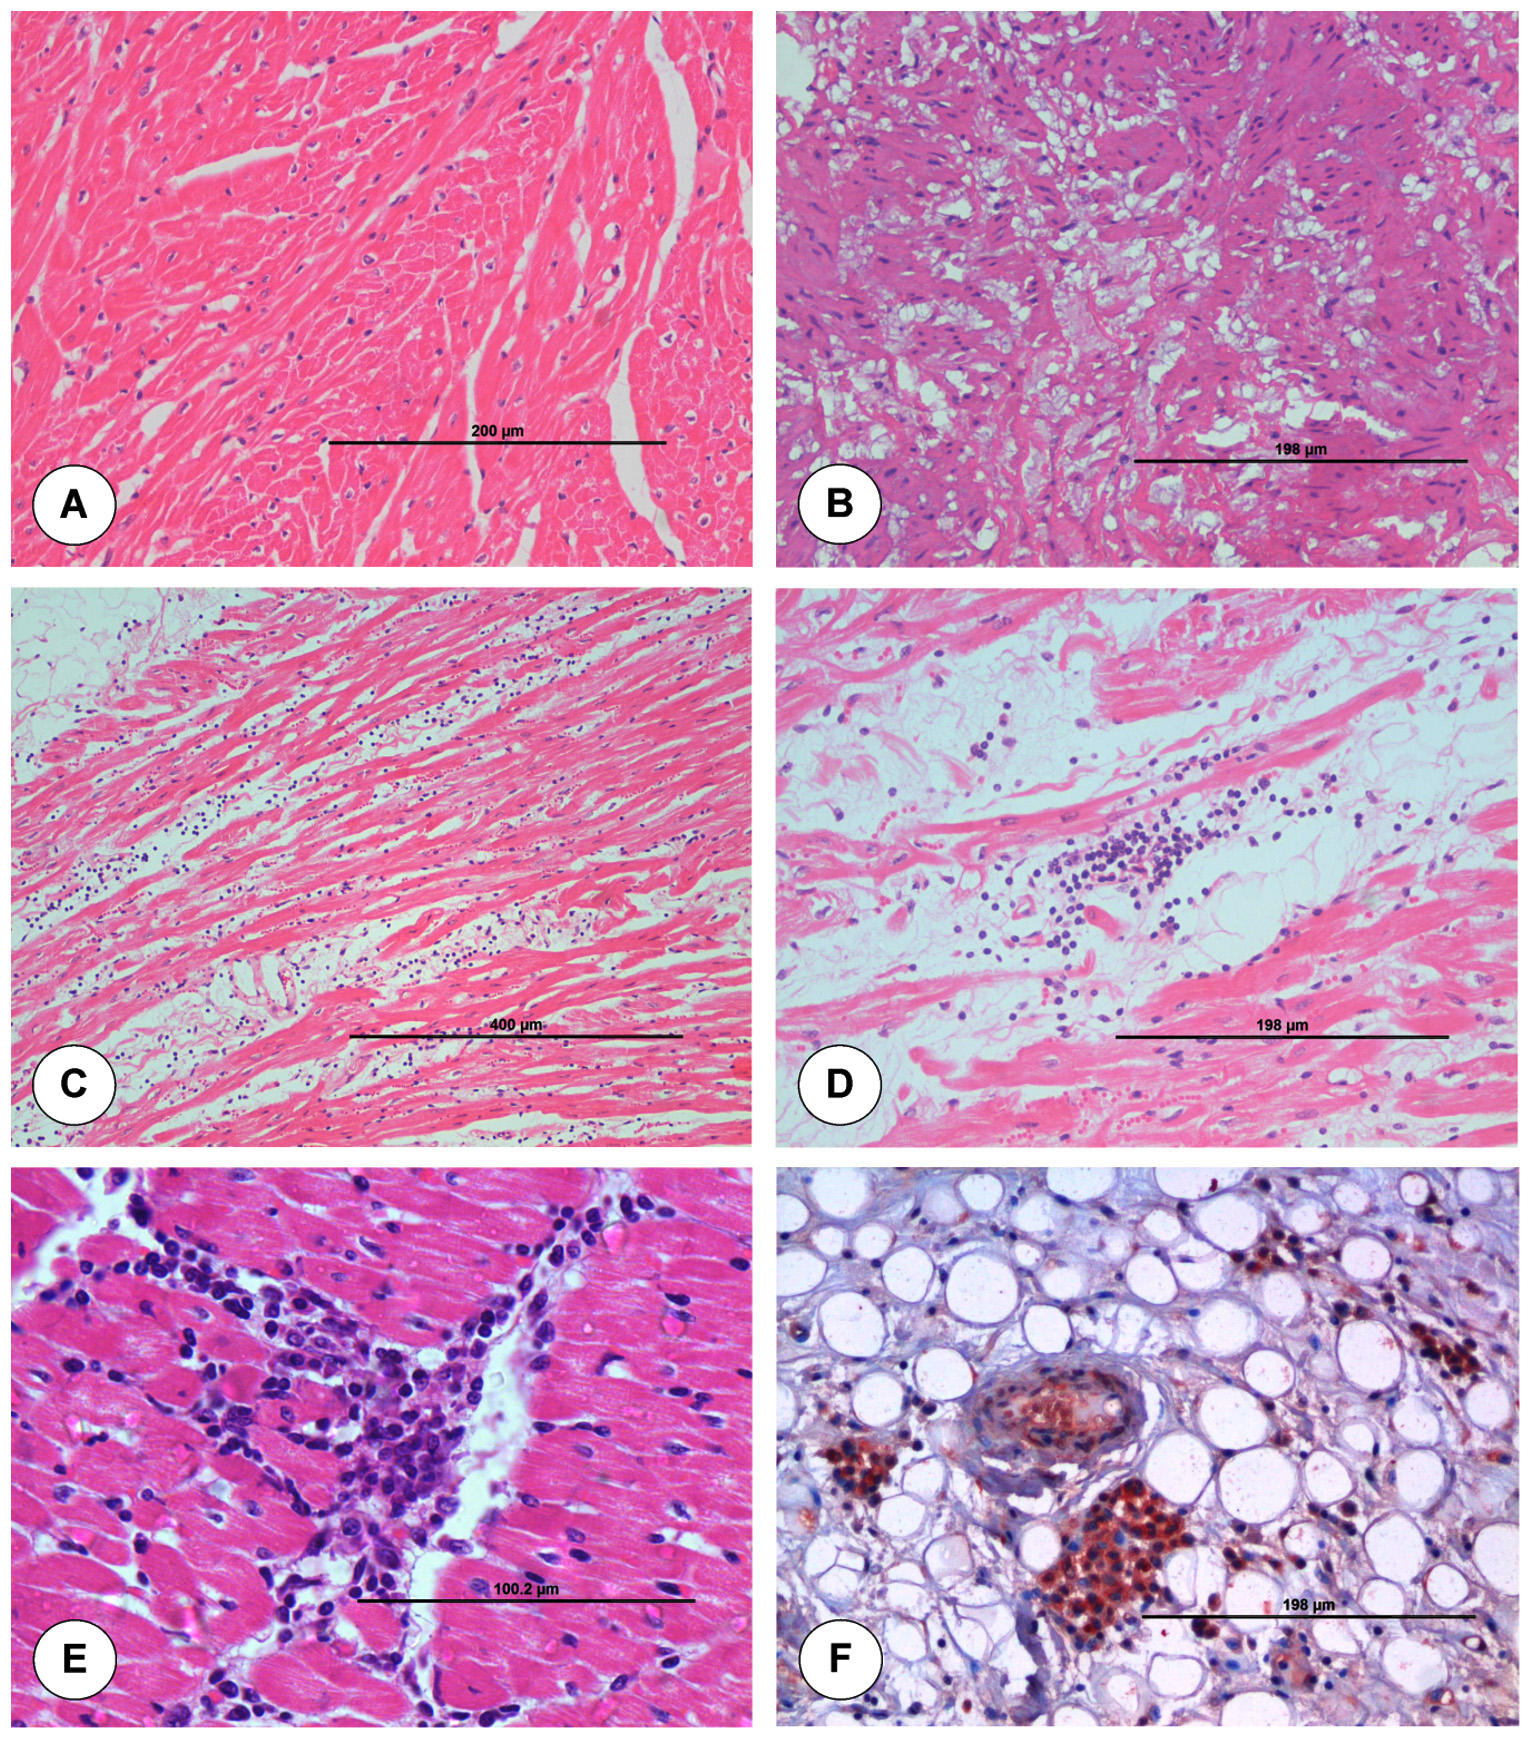
Figure 3. Histopathological lesions at the junction of base of aorta and left ventricle in uninfected control (A) and BTV-4 infected (B-F) groups. A. Transverse section of normal cardiac muscle fibres. H&E x200. B. Tunica media of pulmonary artery showed severe vacuolar degeneration at 3 dpi. H&E x200. C. Marked degeneration and infiltration of mononuclear cells in myocardial fibres at 7 dpi. H&E x100. D. Infiltration of mononuclear cells especially lymphocytes in myocardial fibres at 15 dpi. H&E X200. E. Infiltration of mononuclear cells in myocardial fibres at 21 dpi. H&E X400. F. Positive immunolabelling of BTV antigen in macrophages and endothelial cells of capillaries at 7 dpi. IP-DAB-MH x200.
Lipid peroxidation (LPO)
The concentrations of LPO in various samples of different dpi were given in Table 1 and 2. The LPO values were started to increase on 3 dpi onwards in aorta and pulmonary artery tissue homogenates, hemolysate and serum. On 7 dpi, pulmonary artery and aorta homogenates and serum showed significantly higher and peak values. Thereafter, the values were started to decrease when compared to uninfected control animals.
Table (1):
LPO concentration in haemolysate and serum of BTV-4 infected and uninfected control animals at different dpi (Mean±SEM)
| DPI | Haemolysate | Serum | ||
|---|---|---|---|---|
| Uninfected control | BTV-infected | Uninfected control | BTV-infected | |
| 3 | 305.91±3.41 | 409.21±2.41* | 353.91±1.76 | 435.21±2.41* |
| 5 | 512.16 ±1.25 | 655.93±3.42a* | 556.16±6.54 | 715.93±4.97a* |
| 7 | 331.43±4.73 | 780.17±1.45a* | 421.43±1.61 | 840.17±2.56a* |
| 15 | 160.13±2.06 | 569.89±4.47a* | 250.13±1.90 | 659.89±1.49a* |
| 21 | 171.11±5.209 | 353.35±2.44a* | 261.11±0.59 | 563.35±2.36a* |
| 28 | 259.09±2.59 | 441.81±2.14* | 329.09±0.84 | 451.81±3.579* |
| 60 | 282.3±1.80 | 379±1.47a* | 321.3±1.68 | 319±0.5a* |
| 90 | 236.36±3.86 | 250.91±2.59a* | 326.36±1.47 | 346.91±4.2a* |
Values bearing asterisk (*) differs significantly (P < 0.05) in BTV-4 infected group when compared to uninfected control group at specified time intervals while lowercase letter (a) represents comparison across the days for infected sample with reference to 3 dpi.
Table (2):
LPO concentration in blood vessels of BTV-4 infected and uninfected control animals at different dpi (Mean±SEM)
| DPI | Base of pulmonary artery | Base of aorta | ||
|---|---|---|---|---|
| Uninfected control | BTV-infected | Uninfected control | BTV-infected | |
| 3 | 218.7±1.77 | 364.55±0.65 | 167.93±1.73 | 260.91±2.69* |
| 7 | 209.37±0.829 | 280.8±1.9a | 154.95±1.23 | 244.53±1.56* |
| 15 | 218.73±0.23 | 192.59±0.99a | 139.03±0.83 | 216.09±0.10 |
| 28 | 209.37±0.829 | 352.49±0.99a | 154.95±1.23 | 226.59±1.39a* |
| 60 | 209.37±0.829 | 274.61±0.71a | 154.95±1.23 | 183.28±1.78a* |
| 90 | 209.37±0.829 | 266.07±0.97a | 154.95±1.23 | 225.28±0.78* |
Values bearing asterisk (*) differs significantly (P < 0.05) in BTV-4 infected group when compared to uninfected control group at specified time intervals while lowercase letter (a) represents comparison across the days for infected sample with reference to 3 dpi.
Superoxide dismutase (SOD)
The concentrations of SOD in different samples of various dpi were given in Table 3 and 4. The SOD values were started to decrease on 3 dpi onwards in pulmonary artery and aorta homogenates, hemolysate and serum. In serum, peak decrease was observed on 5 dpi. In pulmonary artery and aorta homogenates, peak decrease was observed on 3 dpi.
Table (3):
SOD concentration in haemolysate and serum of BTV-4 infected and uninfected control animals at different dpi (Mean±SEM)
| DPI | Haemolysate | Serum | ||
|---|---|---|---|---|
| Uninfected control | BTV-infected | Uninfected control | BTV-infected | |
| 3 | 7141.4±5.75 | 7454.61±2.5* | 6232.3±3.5 | 6685.5±4.18* |
| 5 | 8668.1±13.5 | 5759.35±1.45a | 7134.6±3.7 | 4654.87±5.44a* |
| 7 | 7124.7±4 | 6534.51±4.8a* | 7865.3±3.76 | 6213.44±10.04a* |
| 15 | 7798.5±8.6 | 7613.45±2.8a* | 8034.4±4.07 | 7503.32±4.00a* |
| 21 | 7244.4±5.4 | 6449.54±5.93a* | 7023.6±2.28 | 6213.54±10.8a |
| 28 | 8519.8±19.3 | 7581±8.56* | 7642.8±11.4 | 7432±3.59a |
| 60 | 8773.6±7.61 | 7903.55±4.05a* | 7632.5±7.06 | 7123.55±1.65a |
| 90 | 7242.4±7.5 | 6559.41±8.09a* | 7123.5±6.75 | 6345.5±2.74a* |
Values bearing asterisk (*) differs significantly (P < 0.05) in BTV-4 infected group when compared to uninfected control group at specified time intervals while lowercase letter (a) represents comparison across the days for infected sample with reference to 3 dpi.
Table (4):
SOD concentration in blood vessels of BTV-4 infected and uninfected control animals at different dpi (Mean±SEM)
| DPI | Base of pulmonary artery | Base of aorta | ||
|---|---|---|---|---|
| Uninfected control | BTV-infected | Uninfected control | BTV-infected | |
| 3 | 761.75±3.54 | 562.07±1.44* | 892.88±1.96 | 454.27±1.4* |
| 7 | 1065.7±6.2 | 678.83±7.91a* | 947.03±6.33 | 734.42±3.990* |
| 15 | 853.11±2.4 | 777.23±7.02* | 866.23±3.27 | 589.26±8.83a |
| 28 | 1065.7±6.2 | 587.66±1.36a* | 947.03±6.33 | 762.18±6.31a |
| 60 | 1065.7±6.2 | 662.28±2.38a* | 947.03±6.33 | 677.9±9.36a* |
| 90 | 1065.7±6.2 | 685.58±0.95a | 947.03±6.33 | 853.45±1.94a |
Values bearing asterisk (*) differs significantly (P < 0.05) in BTV-4 infected group when compared to uninfected control group at specified time intervals while lowercase letter (a) represents comparison across the days for infected sample with reference to 3 dpi.
Glutathione peroxidase (GPO)
The concentrations of GPO in different samples of various dpi were given in Table 5 and 6. The GPO values were started to decrease on 3 dpi in pulmonary artery and aorta homogenates, hemolysate and serum. Peak decrease was observed on 15 dpi in above mentioned samples when compared to uninfected control animals. Thereafter values were started to increase.
Table (5):
GPO concentration in haemolysate and serum of BTV-4 infected and uninfected control animals at different dpi (Mean±SEM)
| DPI | Haemolysate | Serum | ||
|---|---|---|---|---|
| Uninfected control | BTV-infected | Uninfected control | BTV-infected | |
| 3 | 156.77±4.34 | 123.12±2.8* | 192.77±2 | 150.12±1.38* |
| 5 | 173.26±2.39 | 139.79±3.82* | 192.26±1.84 | 160.79±3.15* |
| 7 | 165.85±1.55 | 137.53±4.539 | 191.85±3.89 | 137.53±4.5* |
| 15 | 156.46±3.08 | 101.73±5.7* | 136.46±3.5 | 111.73±5.78 |
| 21 | 143.85±1.8 | 125.21±0.22 | 158.85±5.9 | 125.21±2.33 |
| 28 | 152.43±1.79 | 143.02±5.61 | 172.43±2.540 | 182.02±2.60 |
| 60 | 170.96±4.98 | 159.85±7.4 | 190.96±3.3 | 189.85±5.319 |
| 90 | 154.5±2.97 | 131.68±4.31 | 164.5±1.53 | 141.68±6.69 |
Values bearing asterisk (*) differs significantly (P < 0.05) in BTV-4 infected group when compared to uninfected control group at specified time intervals while lowercase letter (a) represents comparison across the days for infected sample with reference to day 3 dpi.
Table (6):
GPO concentration in blood vessels of BTV-4 infected and uninfected control animals at different dpi (Mean±SEM)
| DPI | Base of pulmonary artery | Base of aorta | ||
|---|---|---|---|---|
| Uninfected control | BTV-infected | Uninfected control | BTV-infected | |
| 3 | 70.48±3.05 | 46.97±3* | 84.74±2.77 | 48.43±5.56* |
| 7 | 55.32±1.54 | 45.25±2.26* | 75.64±3.98 | 38.87±6.12 |
| 15 | 64.43±3.57 | 32.64±4.21 | 58.4±4.09 | 29.77±1.1* |
| 28 | 55.32±1.54 | 37.89±4.9* | 58.4±4.09 | 32.83±4.76 |
| 60 | 55.32±1.54 | 32.37±2.48 | 58.4±4.09 | 40.57±4.83* |
| 90 | 55.32±1.54 | 44.49±2.05 | 58.4±4.09 | 37.29±0.31 |
Values bearing asterisk (*) differs significantly (P < 0.05) in BTV-4 infected group when compared to uninfected control group at specified time intervals while lowercase letter (a) represents comparison across the days for infected sample with reference to 3 dpi.
Catalase (CAT)
The concentrations of CAT in different samples of various dpi were given in Table 7 and 8. The CAT values were started to decrease on 3 dpi onwards in pulmonary artery and aorta homogenates, hemolysate and serum. In serum, peak decrease was observed on 5 dpi. In pulmonary artery and aorta homogenates, peak decrease was observed on 3 dpi.
Table (7):
CAT concentration in haemolysate and serum of BTV-4 infected and uninfected control animals at different dpi (Mean±SEM)
| DPI | Haemolysate | Serum | ||
|---|---|---|---|---|
| Uninfected control | BTV-infected | Uninfected control | BTV-infected | |
| 3 | 6231.4±178.2 | 5098.61±91.07 | 5321.3±286.8 | 5543.5±510.7 |
| 5 | 7654.1±242.5 | 4432.35±335.05* | 6486.6±165.6 | 3854.87±833.33 |
| 7 | 6587.7±583.1 | 5965.51±732.81 | 6649.3±205.4 | 5976.44±911.84 |
| 15 | 6321.5±586.9 | 6142.45±601.45 | 7543.4±325.7 | 6274.32±219.45a |
| 21 | 6347.4±325.9 | 5764.54±111.06 | 6478.6±261.51 | 5875.54±453.56a |
| 28 | 7432.8±312.1 | 6421±99.1 | 6498.8±301.3 | 6075±468.7a |
| 60 | 7589.6±358.2 | 6549.55±393.45 | 6688.5±96.1 | 6457.55±369.95 |
| 90 | 6346.4±338 | 5987.41±144.42 | 6397.5±354.8 | 6112.5±346.5 |
Values bearing asterisk (*) differs significantly (P < 0.05) in BTV-4 infected group when compared to uninfected control group at specified time intervals while lowercase letter (a) represents comparison across the days for infected sample with reference to 3 dpi.
Table (8):
CAT concentration in blood vessels BTV-4 infected and uninfected control animals at different dpi (Mean±SEM)
| DPI | Base of pulmonary artery | Base of aorta | ||
|---|---|---|---|---|
| Uninfected control | BTV-infected | Uninfected control | BTV-infected | |
| 3 | 542.75±62.32 | 364.07±63.64 | 741.88±38.34 | 396.27±74.63 |
| 7 | 943.7±43.38 | 532.83±23.23 | 843.03±52.37 | 734.42±33.56* |
| 15 | 643.11±47.33 | 586.23±75.93 | 735.23±34.59 | 463.26±60.15 |
| 28 | 957.7±26.04 | 432.66±32.23 | 887.03±44.93 | 657.18±56.64* |
| 60 | 957.7±26.05 | 587.28±74.96* | 887.03±44.93 | 546.9±43.98 |
| 90 | 957.7±26.06 | 549.58±49.15a | 887.03±44.94 | 786.45±86.13* |
Values bearing asterisk (*) differs significantly (P < 0.05) in BTV-4 infected group when compared to uninfected control group at specified time intervals while lowercase letter (a) represents comparison across the days for infected sample with reference to 3 dpi.
Acute phase responses
The mean±SEM of acute phase proteins like CRP and Fibrinogen were given in the Table 9 and 10. The CRP values in serum were seen to be increasing significantly in all dpi in the BTV-4 infected animals compared to uninfected control. Peak increment was observed on 5, 7 and 15 dpi. Concentration of CRP in plasma was also seen to be more in the BTV-infected animals compared to uninfected control mainly on 5 and 7 dpi. Fibrinogen concentration in plasma was found to be upregulating in the BTV-4 infected animals compared to uninfected control. Peak increment in the concentration was seen on 5 dpi; while, the values were decreasing up to 60 and 90 dpi.
Table (9):
CRP concentration in serum and plasma of BTV-4 infected and uninfected control animals at different dpi (Mean±SEM)
| DPI | Serum | Plasma | ||
|---|---|---|---|---|
| Uninfected control | BTV-infected | Uninfected control | BTV-infected | |
| 3 | 710.93±5.95 | 2842.97±10.08* | 734.43±2.57 | 2931.96±7.03* |
| 5 | 776.21±1.45 | 3441.13±12.36* | 745.67±3.78 | 3628.36±12.37a* |
| 7 | 606.44±4.56 | 3880±3.03* | 757.13±2.41 | 4062.17±5.29a* |
| 15 | 657.37±4.49 | 2537.72±5.81* | 733.37±5.28 | 2469.53±9.1* |
| 21 | 663.5±3.75 | 1858.62±14.29* | 646.37±6.61 | 2107.76±8.06a* |
| 28 | 668.23±6.90 | 1455.67±4.12* | 601.27±1.50 | 1715.76±13a* |
| 60 | 578.46±3.24 | 848.73±4.85a* | 729.33±4.0 | 1094.12±11.3a* |
| 90 | 617.45±2.45 | 603.93±2.280 | 734.43±4.73 | 2931.96±4.30* |
Values bearing asterisk (*) differs significantly (P < 0.05) in BTV-4 infected group when compared to uninfected control group at specified time intervals while lowercase letter (a) represents comparison across the days for infected sample with reference to 3 dpi.
Table (10):
Fibrinogen concentration in serum of BTV-4 infected and uninfected control animals at different dpi (Mean±SEM)
DPI |
Uninfected control |
BTV infected |
|---|---|---|
3 |
210±3.44 |
194±1.349 |
5 |
146.5±2.5 |
337.5±4.51a* |
7 |
247.5±0.5 |
273.5±3.06a |
15 |
205.5±4.81 |
179±5.12 |
21 |
309±4.13 |
210±6.43* |
28 |
244.5±2.52 |
247.5±2.52a* |
60 |
305.5±3.38 |
193.5±1.27 |
90 |
204±1.97 |
181±2.979* |
Values bearing asterisk (*) differs significantly (P < 0.05) in BTV-4 infected group when compared to uninfected control group at specified time intervals while lowercase letter (a) represents comparison across the days for infected sample with reference to 3 dpi.
Prothrombin time
Prothrombin time in seconds was seen more in the BTV-4 infected animals as compared to uninfected control animals, and much upregulation in time was seen up to 15 dpi after which, the values were in normal range (Table 11).
Table (11):
Prothrombin time in plasma of BTV-4 infected and uninfected control animals at different dpi (Mean±SEM)
DPI |
Uninfected control |
BTV infected |
|---|---|---|
3 |
29.03±3.57 |
33.25±2.62 |
5 |
35.54±2.11 |
30.35±3.61 |
7 |
25.75±1.12 |
31.25±0.5 |
15 |
23.15±2.19 |
31.22±1.12 |
21 |
39.49±5.63 |
22.8±4.06 |
28 |
36.875±1.1 |
33.26±1.61 |
60 |
31.94±0.819 |
31.72±1.72 |
90 |
28.27±1.48 |
29.77±1.77 |
Values bearing asterisk (*) differs significantly (P < 0.05) in BTV-4 infected group when compared to uninfected control group at specified time intervals while lowercase letter (a) represents comparison across the days for infected sample with reference to 3 dpi.
Demonstration of BTV by immunohistochemistry
Positive immunolabelling of BTV antigen was demonstrated by immunohistochemistry using BTV VP7 monoclonal antibody in macrophages, lymphocytes and endothelial cells in base of pulmonary artery (Figure 2F) and aorta (Figure 3F). Positive brown signals indicated the presence of BTV antigen.
Detection of BTV by Nested PCR
After second round of amplification, 101 bp product was visible in the base of aorta and base of pulmonary artery (Figure 4); while, no bands were visible in the gel of uninfected control samples.
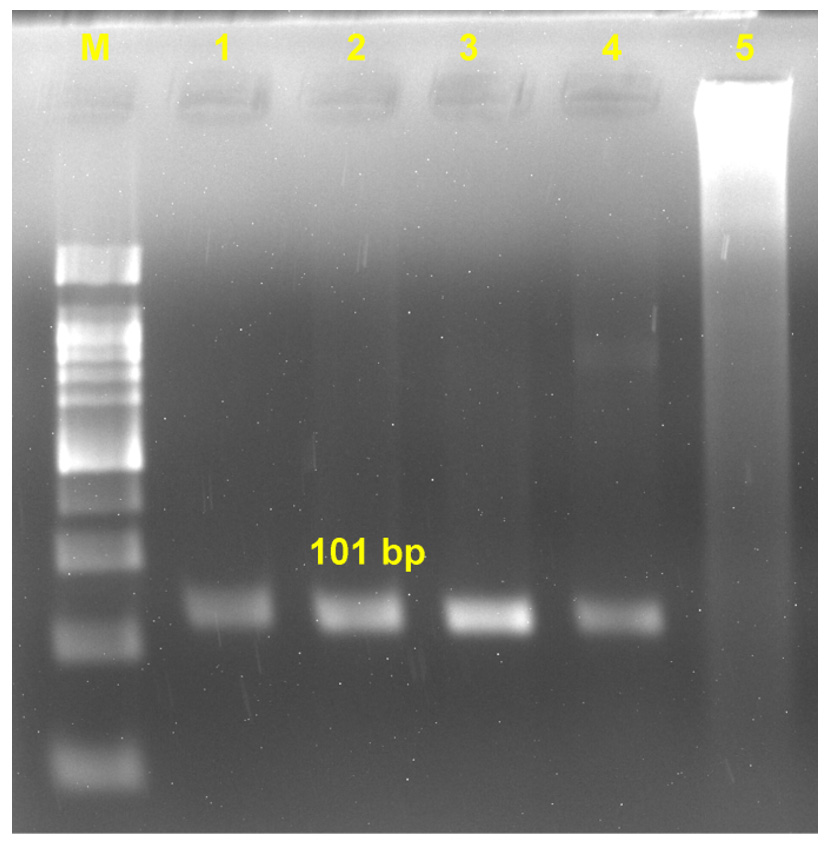
Figure 4. RT-PCR detection of amplified product (101 bp) of BTV nucleic acid. Lane M: 50 bp DNA ladder; L1: Base of pulmonary artery; L2: Base of aorta; L3: Positive control; L4: Blood; L5: Negative control
The main pathogenesis and severity caused by BTV infection in animals is due to the injury to the endothelial cells of the blood vessels especially small blood vessels in the target tissues, while replicating in these cells.1 Injury to endothelial cells leads to necrosis of the cells causing tissue infarction, vascular thrombosis, and haemorrhages.19 The exact cause of endothelial injury is still need to be discovered as it cannot be simply due to direct virus mediated cytolysis leading to DIC. Increased IL-6 produced inside the vascular wall might induce vascular dysfunction by increasing ROS and decreasing NO, which subsequently promotes immune cell activation and vascular infiltration inside an autocrine or paracrine manner.20 Hence, in the present study, the role of oxidative stress in causing endothelial dysfunction during experimental BTV-4 infection in sheep was studied.
In the present study, increased LPO concentration was seen in aorta and pulmonary artery homogenates and in blood hemolysate of BTV-infected animals, indicating increased level of lipid peroxidation within the tissues. It has been observed that lipid peroxidation is considered to be the most important and majorly used parameter to assess the oxidative stress.16 In the present study, due to increased oxidant level like MDA, the antioxidant status decreases in the tissues.21 This imbalance can occur in body cells due to any change in the health status like any viral infection due to which reactive oxygen species increases in the body and antioxidants get consumption at high rate leading to its downregulation.22 Hence, it can be said that together in any viral disease, there is increased inflammation with increased oxidative stress and decreased antioxidant defences as seen in previous study by Stanojkovica et al.23 on chronic obstructive pulmonary disease. In the present study, MDA level got upregulated in arterial homogenates and in blood; while, the antioxidant enzymes (SOD, GPX and CAT) in arterial homogenate and blood were seen downregulated showing the role of oxidative stress in causing endothelial injury due to BTV infection in animals. Catalase, an essential enzyme uses hydrogen peroxide as its substrate a nonradical ROS and breaks down hydrogen peroxide to neutralize it and to maintain it at an optimal amount in the cell. An attempt has been made to correlate the pathology and progression of oxidative stress in BTV infection with the function of catalase in the present article and it was seen downregulated emphasizing oxidative stress in the cell. The increase in MDA and decrease in total antioxidant stress in bluetongue viral infection was in accordance with the previous studies by Aytekin et al.24
The CRP is an important biomarker of inflammation and it plays important role in tracing the progress of infection. The CRP is a major marker for bacterial disease compared to viral disease, so upregulation of CRP in this study was correlated with immunosuppression caused by BTV infection leading to secondary bacterial infection.25 The fibrinogen concentration got upregulated during inflammation was in agreement with the previous study.26 According to Howerth et al.27 the fibrinogen concentration was seen upregulated initially and then decreased, but the concentration was above the pre-inoculation values. In contrast to this finding, in the study conducted by Maclachlan et al.,28 there was no significant change in fibrinogen concentration and was not consistent with clinical signs and disseminated intravascular coagulation.
In the present study, the value of prothrombin time was found to be prolonged in the BTV-infected animals compared to uninfected control animals and this was in accordance with the previous study by Howerth et al.,27 in which prothrombin time was prolonged after giving BTV-infection in White-tailed deer. Further, in the previous studies, it has been reported that factor VIII, XII and number of platelets also gets downregulated along with upregulation of prothrombin time.27,28 These findings of decrease in platelet count along with coagulation disorder causes prolonged bleeding and formation of hematoma on venipuncture site.28 Simultaneously increased prothrombin time and increase in fibrinogen concentration in initial days of infection suggested coagulation abnormality in the host. In the previous study, it has been seen that thromboxane to prostacyclin ratio increases in BTV-infected sheep indicating enhanced coagulation.29
The histopathological lesions were marked necrosis in tunica media of pulmonary artery and aorta, congestion, mononuclear cells infiltration, capillary damage with haemorrhages and oedema, and perivascular cuffing seen in this study, which can be correlated to the earlier studies.28 Further, in this study on 7 dpi, endothelial cells of the major vessels were found swollen, which may be due to hypertrophy leading to sloughing of these cells into the lumen of arteries, which can be related to the study done by Saminathan et al.30
Presence of BTV antigen in the arteries was confirmed by immunohistochemistry and RT-PCR. As per the previous studies for locating the BTV antigen in blood vessels, it was seen that endothelial cells of capillaries and arterioles were mostly associated with the antigen.30 In the present study, larger arteries like aorta and pulmonary artery were found positive for BTV antigen by immunohistochemistry.
This is the first in vivo study conducted in experimentally infected sheep with BTV-4 to understand the pathogenesis of endothelial injury induced by bluetongue virus through the role of oxidative stress. Aorta and pulmonary artery were equally affected in BTV-4 infection. In the present study, increase in acute phase proteins like CRP and fibrinogen also showed the effect of acute phase proteins in the pathogenesis of bluetongue virus infection. Oxidative stress in the endothelium leads to endothelial cell injury and cell death, along with this lowering of prothrombin time and upregulation of fibrinogen concentration causes coagulation disorders in BTV infected animals leading to disseminated intravascular coagulation, which ultimately results into damage to the blood vessels causing haemorrhages and various other vascular disorders in BTV infected animal.
ACKNOWLEDGMENTS
The authors are grateful to the Joint Director (Research) and Director, ICAR-Indian Veterinary Research Institute (ICAR-IVRI), Deemed University, Bareilly, Uttar Pradesh for providing the necessary facilities to carry out this work. The first author is thankful to the Indian Council of Agricultural Research (ICAR) for providing a Junior Research Fellowship (JRF).
CONFLICT OF INTEREST
The authors declare that there is no conflict of interest.
AUTHORS’ CONTRIBUTION
MS conceptualized and visualized the study. DS and MS performed investigation. MD, AS, DR, SP, AAPM, DS performed data curation. MD, AS, DR, DS applied methodology. DS, MD, AS, DR, SP and AAPM performed formal analysis. SP, KPS and AAPM performed validation. MS wrote original draft. GKS and KD wrote, reviewed and edited the manuscript. KPS performed supervision and project administration. All authors read and approved the final manuscript for publication.
FUNDING
The study was financially supported by ICAR-Indian Veterinary Research Institute, Izatnagar, Bareilly, Uttar Pradesh, India.
DATA AVAILABILITY
All datasets generated or analyzed during this study are included in the manuscript.
ETHICS STATEMENT
This study was approved by the Joint Directorate of Research, ICAR-Indian Veterinary Research Institute, Izatnagar, Uttar Pradesh, India, with protocol number IAEC/27.11.2021.L3
- Saminathan M, Singh KP, Khorajiya JH, et al. An updated review on bluetongue virus: epidemiology, pathobiology, and advances in diagnosis and control with special reference to India. Vet Q. 2020;40(1):258-321.
Crossref - Singh KP, Saminathan M, Dinesh M, et al. Epidemiology and pathology of bluetongue virus in India: A systematic review. Indian J Vet Pathol. 2021;45(3):151-174.
Crossref - Hemati B, Contreras V, Urien C, et al. Bluetongue virus targets conventional dendritic cells in skin lymph. J Virol. 2009;83(17):8789-8799.
Crossref - Rodríguez-Sánchez B, Sánchez-Cordón PJ, Molina V, et al. Detection of bluetongue serotype 4 in mouflons (Ovis aries musimon) from Spain. Vet Microbiol. 2010;141(1-2):164-167.
Crossref - Drew CP, Heller MC, Mayo C, Watson JL, MacLachlan NJ. Bluetongue virus infection activates bovine monocyte-derived macrophages and pulmonary artery endothelial cells. Vet Immunol Immunopathol. 2010;136(3-4):292-296.
Crossref - Pennathur S, Heinecke JW. Oxidative stress and endothelial dysfunction in vascular disease. Curr Diab Rep. 2007;7(4):257-264.
Crossref - Gordon AH, Koj A. The acute-phase response to injury and infection, Introduction. Research Monographs in Cell and Tissue Physiology; msterdam; New York: Elsevier; New York, NY, USA. 1985;10.
- Sobharani V, Singh KP, Maity M, et al. Comparative study on hemato-biochemical alterations and selected acute phase protein response in native sheep experimentally infected with bluetongue virus serotypes 10 and 24. Comp Clin Pathol. 2019;28:1153-1163.
Crossref - Triplett DA. Coagulation and bleeding disorders: review and update. Clin Chem. 2000;46(8):1260-1269.
Crossref - Nakanishi K, Tajima F, Nakamura A, et al. Effects of hypobaric hypoxia on antioxidant enzymes in rats. J Physiol. 1995;489(3):869-876.
Crossref - Chaudhary AK, Nokubo M, Reddy GR, Yeola SN, Morrow JD, Blair LA, Marnett LJ. Detection of endogenous malondialdehyde-deoxyguanosine adducts in human liver. Science. 1994;265(5178):1580-1582.
Crossref - Dworski R. Oxidant stress in asthma. Thorax. 2000;55(suppl 2).
Crossref - Beaudeux JL, Gardes-Albert M, Delattre J, Legrand A, Rousselet F, Peynet J. Resistance of lipoprotein (a) to lipid peroxidation induced by oxygenated free radicals produced by γ radiolysis: a comparison with low-density lipoprotein. Biochem J. 1996;314(1):277-284.
Crossref - Teixeira HD, Schumacher RI, Meneghini R. Lower intracellular hydrogen peroxide levels in cells overexpressing CuZn-superoxide dismutase. Proc Natl Acad Sci U S A. 1998;95(14):7872-7875.
Crossref - Turrens JF, Crapo JD, Freeman B. Protection against oxygen toxicity by intravenous injection of liposome-entrapped catalase and superoxide dismutase. J Clin Invest. 1984;73(1):87-95.
Crossref - Esterbauer H, Gebicki J, Puhl H, Jürgens G. The role of lipid peroxidation and antioxidants in oxidative modification of LDL. Free Radic Biol Med. 1992;13(4):341-390.
Crossref - Paglia DE, Valentine WN. Studies on the quantitative and qualitative characterization of erythrocyte glutathione peroxidase. J Lab Clin Med. 1967;70(1):158-169.
Crossref - Luna LG. Manual of histologic staining methods of the Armed Forces Institute of Pathology. In: Manual of Histologic Staining Methods of the Armed Forces Institute of Pathology. 3rd Edition; Blakiston Division, McGraw-Hill, New York;1968.
- Darpel KE, Batten CA, Veronesi E, et al. Transplacental transmission of bluetongue virus 8 in cattle, UK. Emerg Infect Dis. 2009;15(12):2025.
Crossref - Wolf S, Höfte H. Growth control: a saga of cell walls, ROS, and peptide receptors. Plant Cell. 2014;26(5):1848-1856.
Crossref - Olisekodiaka MJ, Igbeneghu CA, Onuegbu AJ, Oduru R, Lawal AO. Lipid, lipoproteins, total antioxidant status and organ changes in rats administered high doses of cadmium chloride. Med Princ Pract. 2012;21(2):156-159.
Crossref - Adıgüzel E, Oğuzoğlu TÇ. How do viruses use oxidative stress? J Istanbul Vet Sci. 2022;6(2):90-97.
Crossref - Stanojkovic I, Kotur-Stevuljevic J, Milenkovic B, et al. Pulmonary function, oxidative stress and inflammatory markers in severe COPD exacerbation. Respir Med. 2011;105(Suppl)
Crossref - Aytekin I, Aksit H, Sait A, et al. Evaluation of oxidative stress via total antioxidant status, sialic acid, malondialdehyde and RT-PCR findings in sheep affected with bluetongue. Vet Rec Open. 2015;2(1)
Crossref - Umeshappa CS, Singh KP, Nanjundappa RH, Pandey AB. Apoptosis and immuno-suppression in sheep infected with bluetongue virus serotype-23. Vet Microbiol. 2010;144(3-4):310-318.
Crossref - Hirvonen A, Immonen T, Leinonen P, Alhonen-Hongisto L, Jänne OA, Jänne J. Effect of dexamethasone on the activity and expression of ornithine decarboxylase in rat liver and thymus. Biochim Biophys Acta Gene Struct Expr. 1988;950(2):229-233.
Crossref - Howerth EW, Tyler DE. Experimentally induced bluetongue virus infection in white-tailed deer: ultrastructural findings. Am J Vet Res. 1988;49(11):1914-1922.
- MacLachlan NJ, Crafford JE, Vernau W, Gardner IA, Goddard A, Guthrie AJ, Venter EH. Experimental reproduction of severe bluetongue in sheep. Vet Pathol. 2008;45(3):310-315.
Crossref - DeMaula CD, Leutenegger CM, Bonneau KR, MacLachlan NJ. The role of endothelial cell-derived inflammatory and vasoactive mediators in the pathogenesis of bluetongue. Virology. 2002;296(2):330-337.
Crossref - Saminathan M, Singh KP, Maity M, et al. Pathological and immunological characterization of bluetongue virus serotype 1 infection in type I interferons blocked immunocompetent adult mice. J Adv Res. 2021;31:137-153.
Crossref
© The Author(s) 2024. Open Access. This article is distributed under the terms of the Creative Commons Attribution 4.0 International License which permits unrestricted use, sharing, distribution, and reproduction in any medium, provided you give appropriate credit to the original author(s) and the source, provide a link to the Creative Commons license, and indicate if changes were made.